Home
Start page for project state, active incidents, camera health and current warnings.
Details and features
This page describes the most important operating pages and system functions for users, integrators and potential customers who want to evaluate JC Thermal Monitor as a monitoring product, pilot installation or temporary diagnostics platform in more detail.
System goal
JC Thermal Monitor is an on-premise system for industrial plants and technical diagnostic projects where thermal states need to be observed over time, evaluated and documented as a decision basis. The current target integration is FLIR AX8. Support for additional FLIR A-Series cameras such as A40/A50/A70 is planned as a next extension step. The system connects camera and ROI data, camera-side digital signals and Modbus-adjacent camera states with alarm rules, incidents, snapshot evidence, evidence reports, tickets, Viewer monitor access and diagnostic information. JC Thermal Monitor is suitable for new thermal monitoring installations and as a retrofit extension for existing FLIR AX8-based systems. It can be installed next to an existing AX8 system because normal monitoring reads camera registers and does not replace the original plant function. This adds database-backed measurement history, visualization, alarm workflows, reports and exportable evidence for maintenance processes to existing installations. Only camera-side AX8 digital outputs need clear ownership: either the camera/existing system or Thermal Monitor should control the same output.
Spot and box ROIs are still enabled and positioned in the AX8 web interface. After ROI sync, those enabled measurement points appear in Thermal Monitor and can be used in Conditions and Actions. Rules can combine ROIs and DI/DO signals from several separate cameras, creating a true multi-camera system with database history for temperature values, events, incident states, ticket states, reports and exportable Visualization analysis.
User interface
The following entries link to the detailed descriptions of each page. The screenshots show the most important interfaces and tasks in the system.
Start page for project state, active incidents, camera health and current warnings.
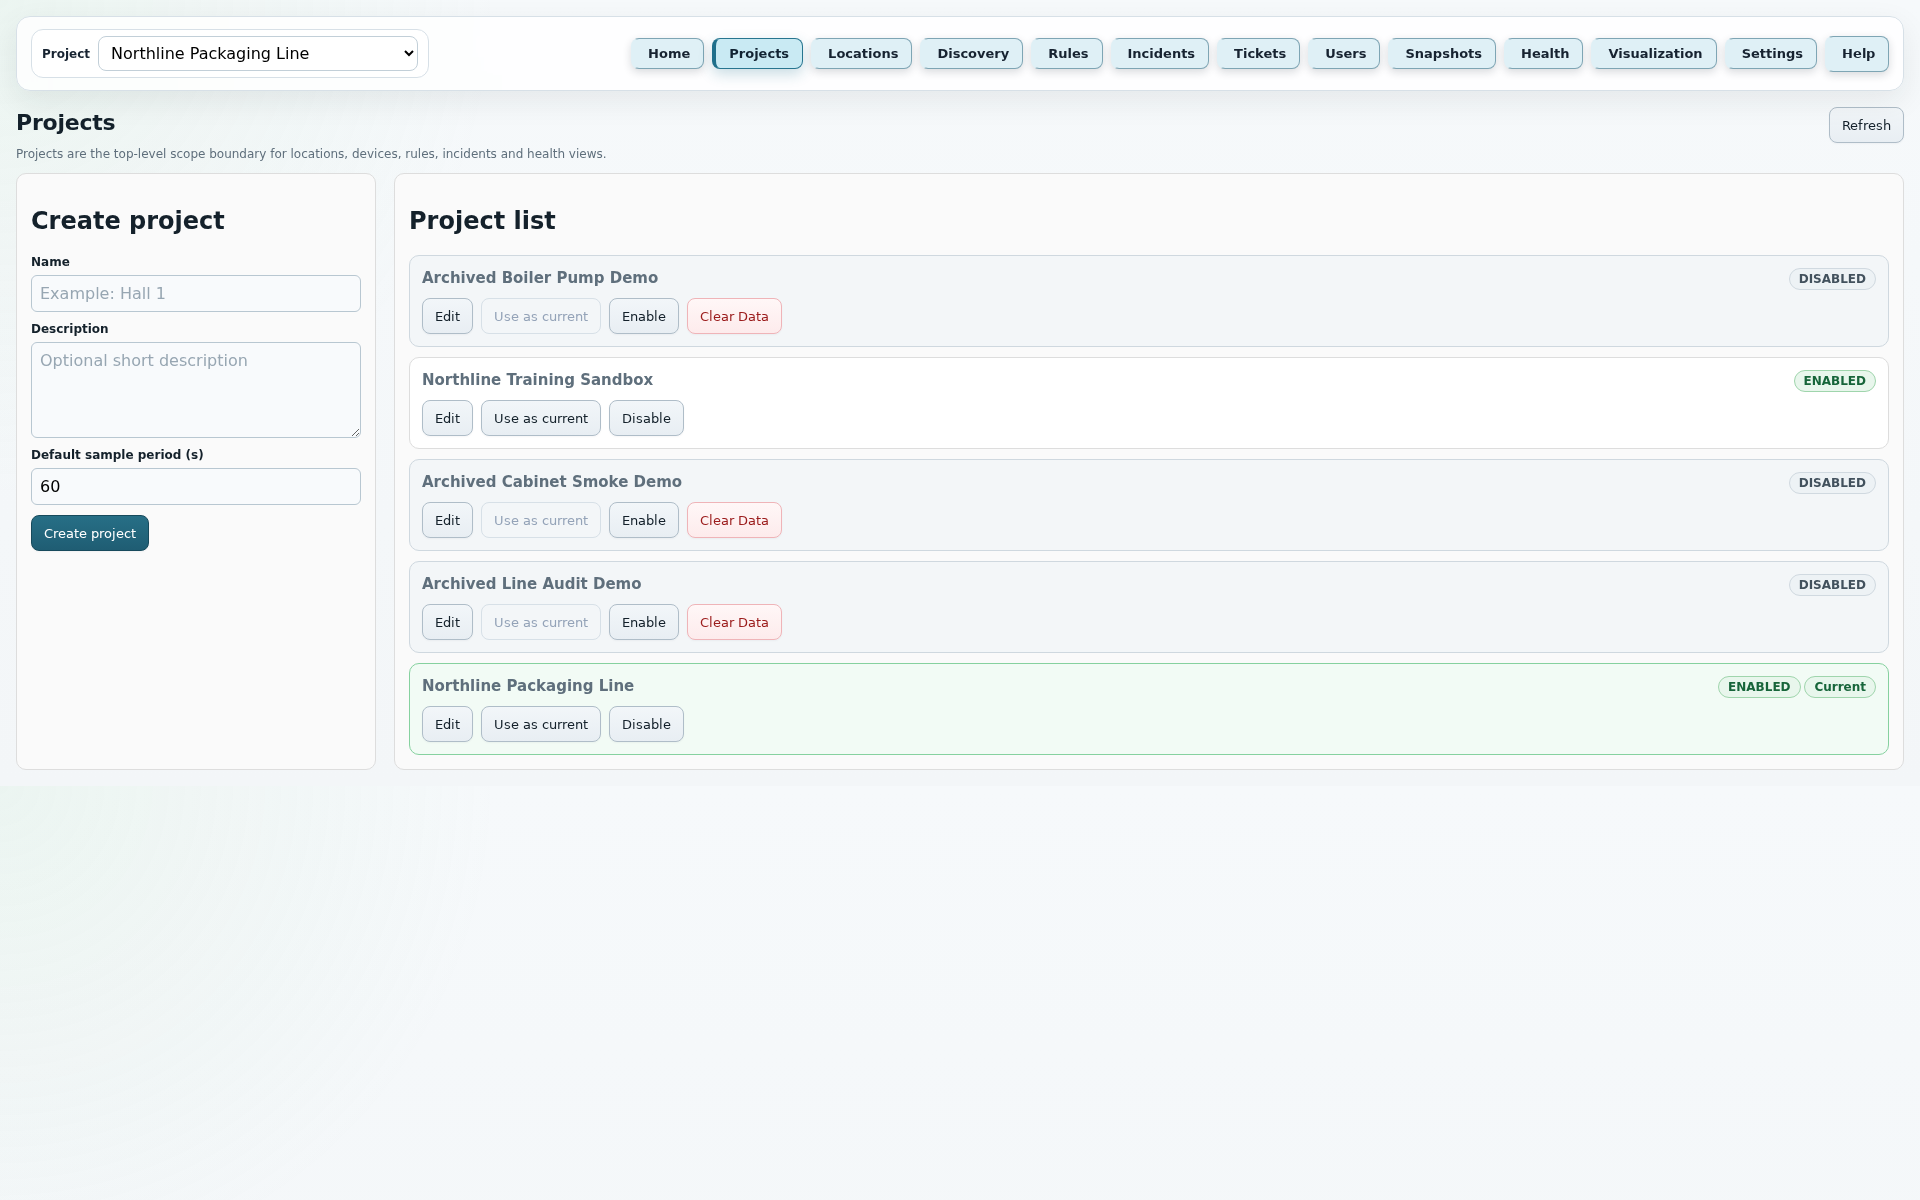
Management of projects, project status, report data and default sampling.
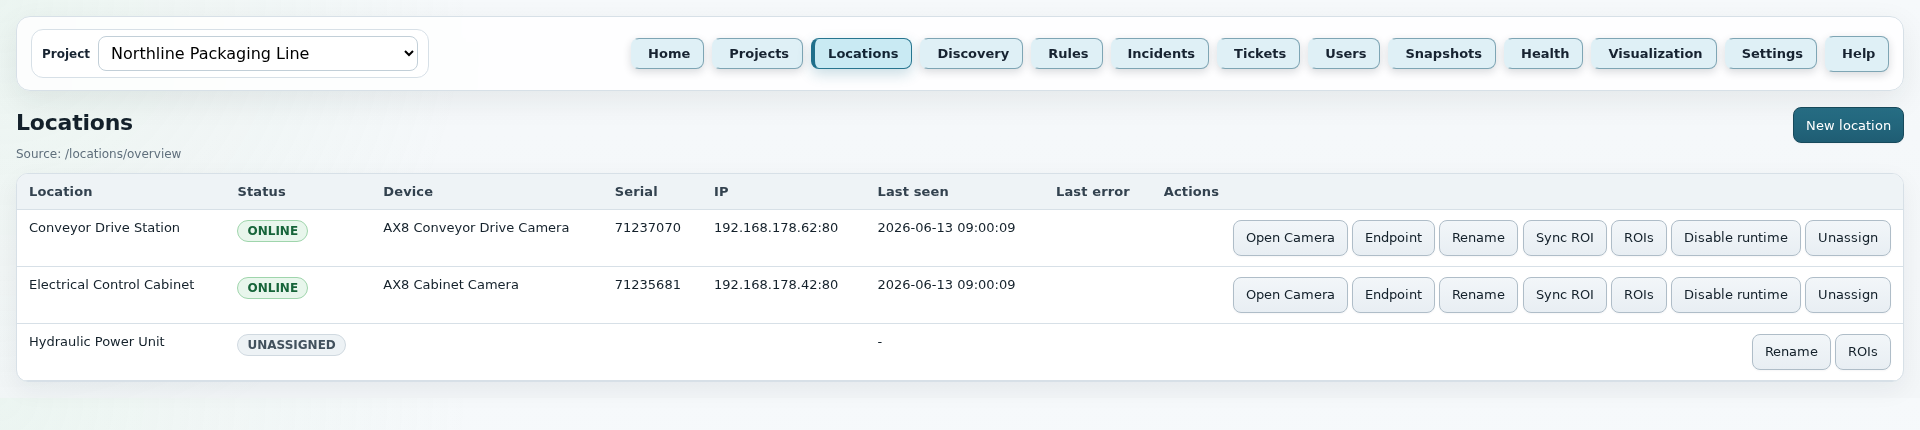
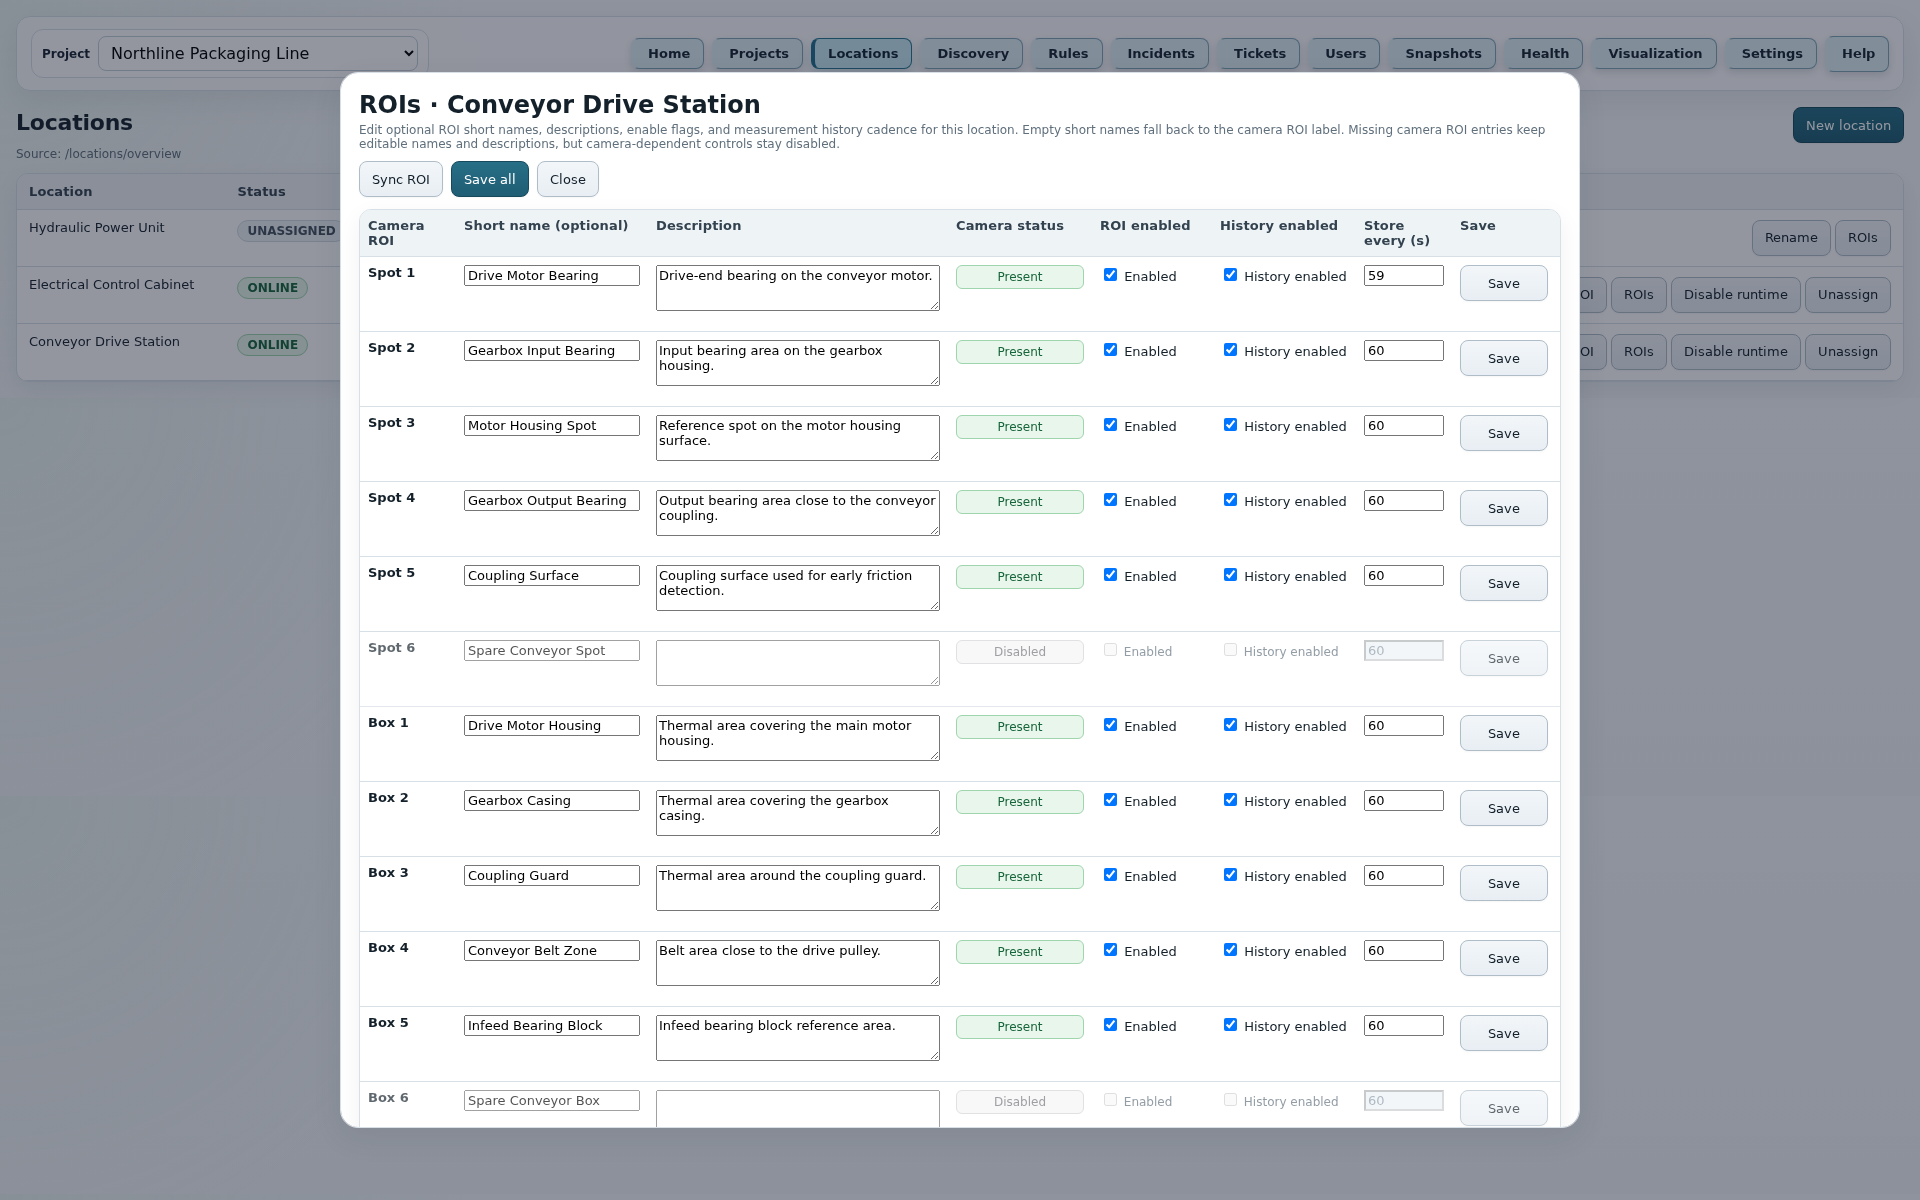
Locations, device assignment, endpoint settings, ROI synchronization and ROI storage.
Network search, Known state and assignment of reachable devices to free locations.
Configuration of virtual alarm rules with conditions, filters, actions and runtime state.
Handling of active and closed incidents with history, evidence and snapshots.
Investigation workflow for incidents with checklist, notes, measurements and attachments.
Admin area for users, roles, active state, editing and password reset.
Snapshot jobs, stored images, annotated evidence and cleanup.
Operational health for camera, ROIs, rules, workers, impulse runtime, system incidents, e-mail and snapshot jobs.
Shared timeline for temperature series, digital signals and incident markers.
Runtime parameters for polling, display, auto-refresh, report data, e-mail and diagnostics.
Screen details
JC Thermal Monitor
The Home page is the daily entry point for operators. It shows whether the selected project is thermally stable, whether incidents are open and whether cameras or background processes need attention.
These points mirror the current application Help texts and describe the most important fields, buttons and runtime rules of this page.
JC Thermal Monitor
The Projects page separates customers, plants, locations and pilot installations cleanly. A project bundles locations, rules, incidents, tickets, reports and visualization.
These points mirror the current application Help texts and describe the most important fields, buttons and runtime rules of this page.
JC Thermal Monitor
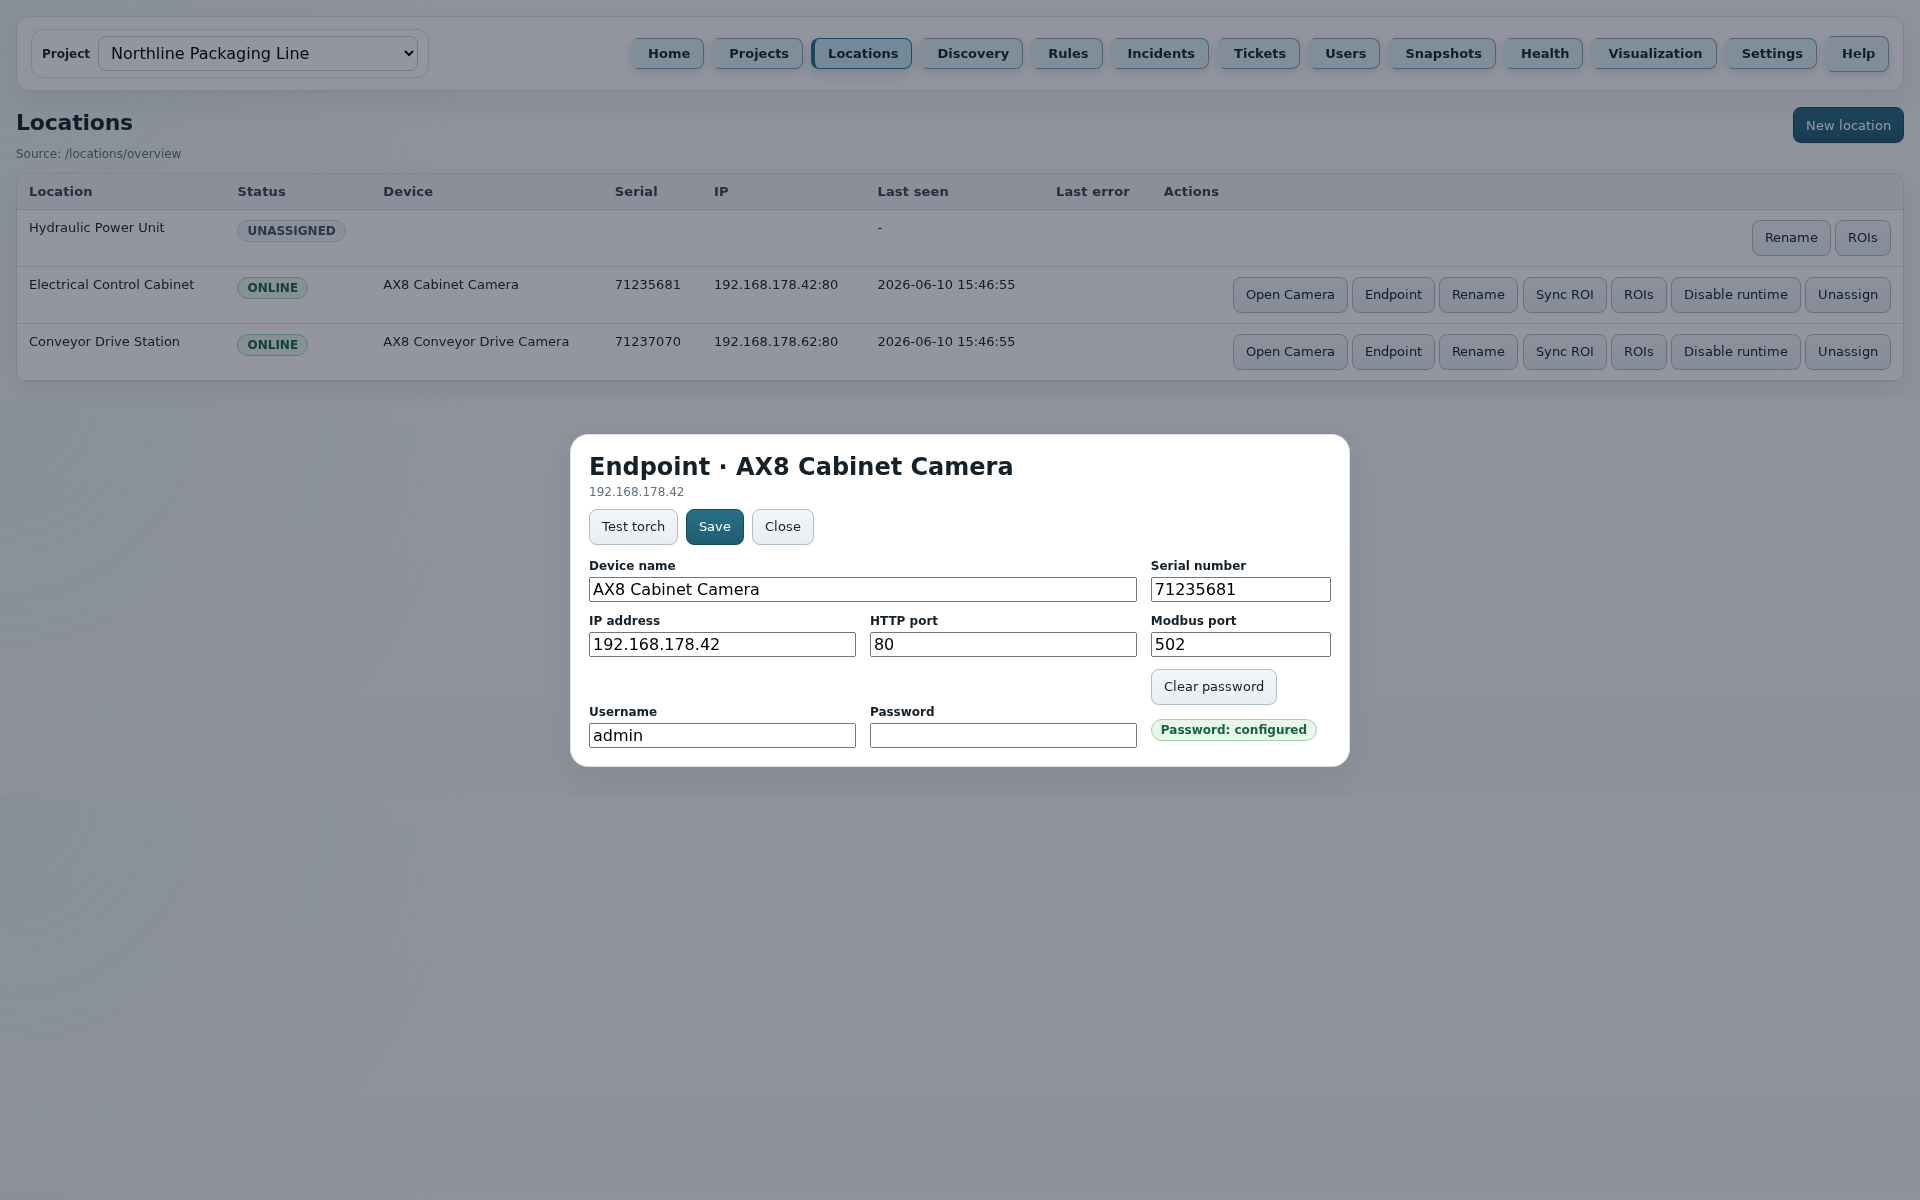
Locations connect real plant areas with cameras and ROIs. This page shows which camera is assigned to a location, whether runtime is active and which endpoint and ROI settings are maintained.
These points mirror the current application Help texts and describe the most important fields, buttons and runtime rules of this page.
The detail images complement the compact location list with the ROI panel and Endpoint dialog. Passwords are not displayed again; the UI only shows whether one is configured.
JC Thermal Monitor
Discovery supports commissioning and maintenance by searching for reachable cameras or devices on the network, matching them with known endpoints and assigning them to free locations.
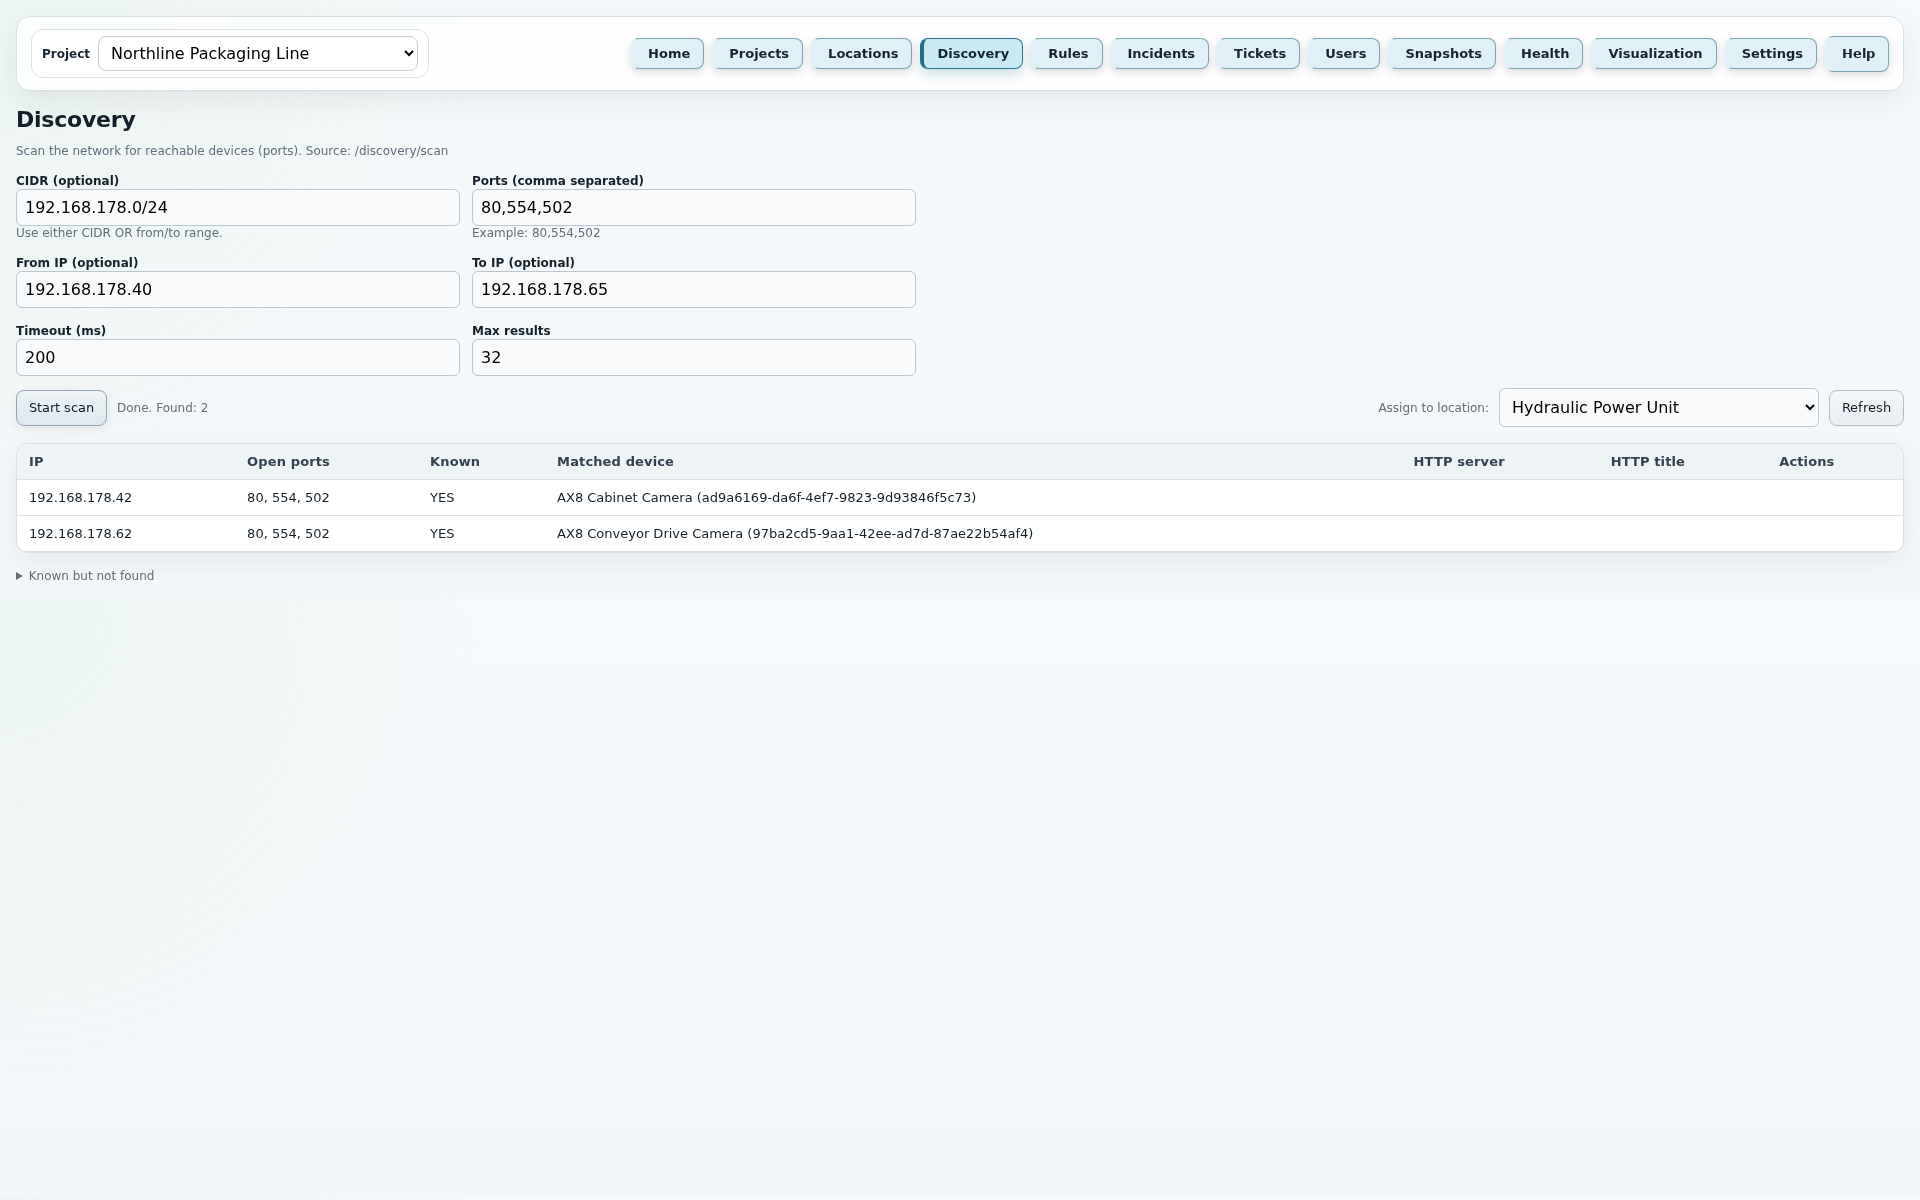
These points mirror the current application Help texts and describe the most important fields, buttons and runtime rules of this page.
JC Thermal Monitor
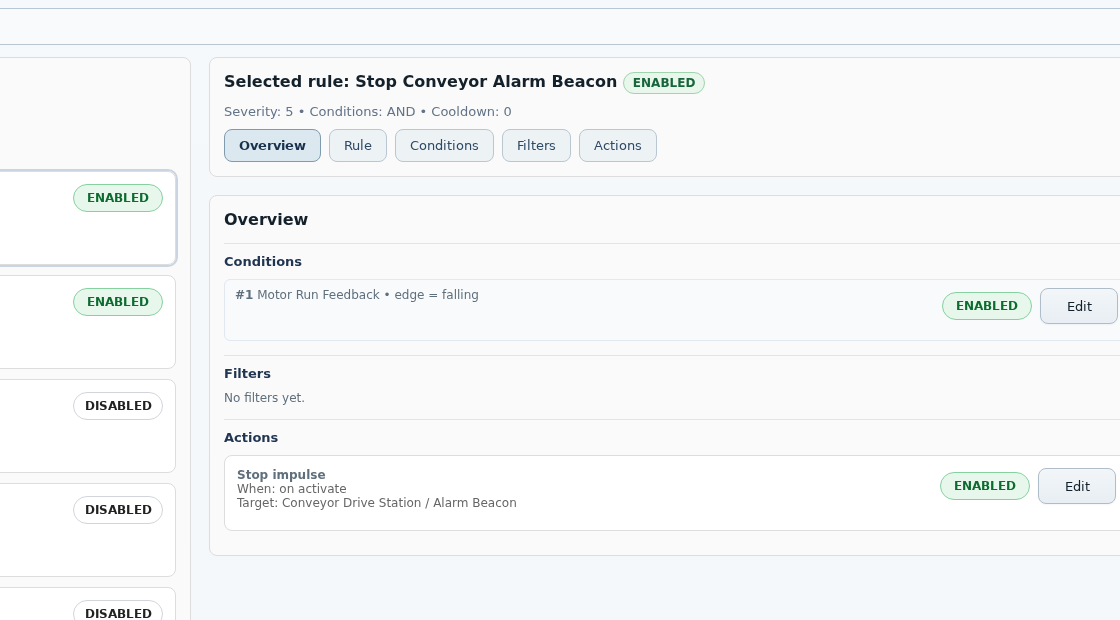
The Rules page is the technical control center of the monitoring system. Measurements, digital states and time-based conditions are turned into traceable alarm rules with actions.
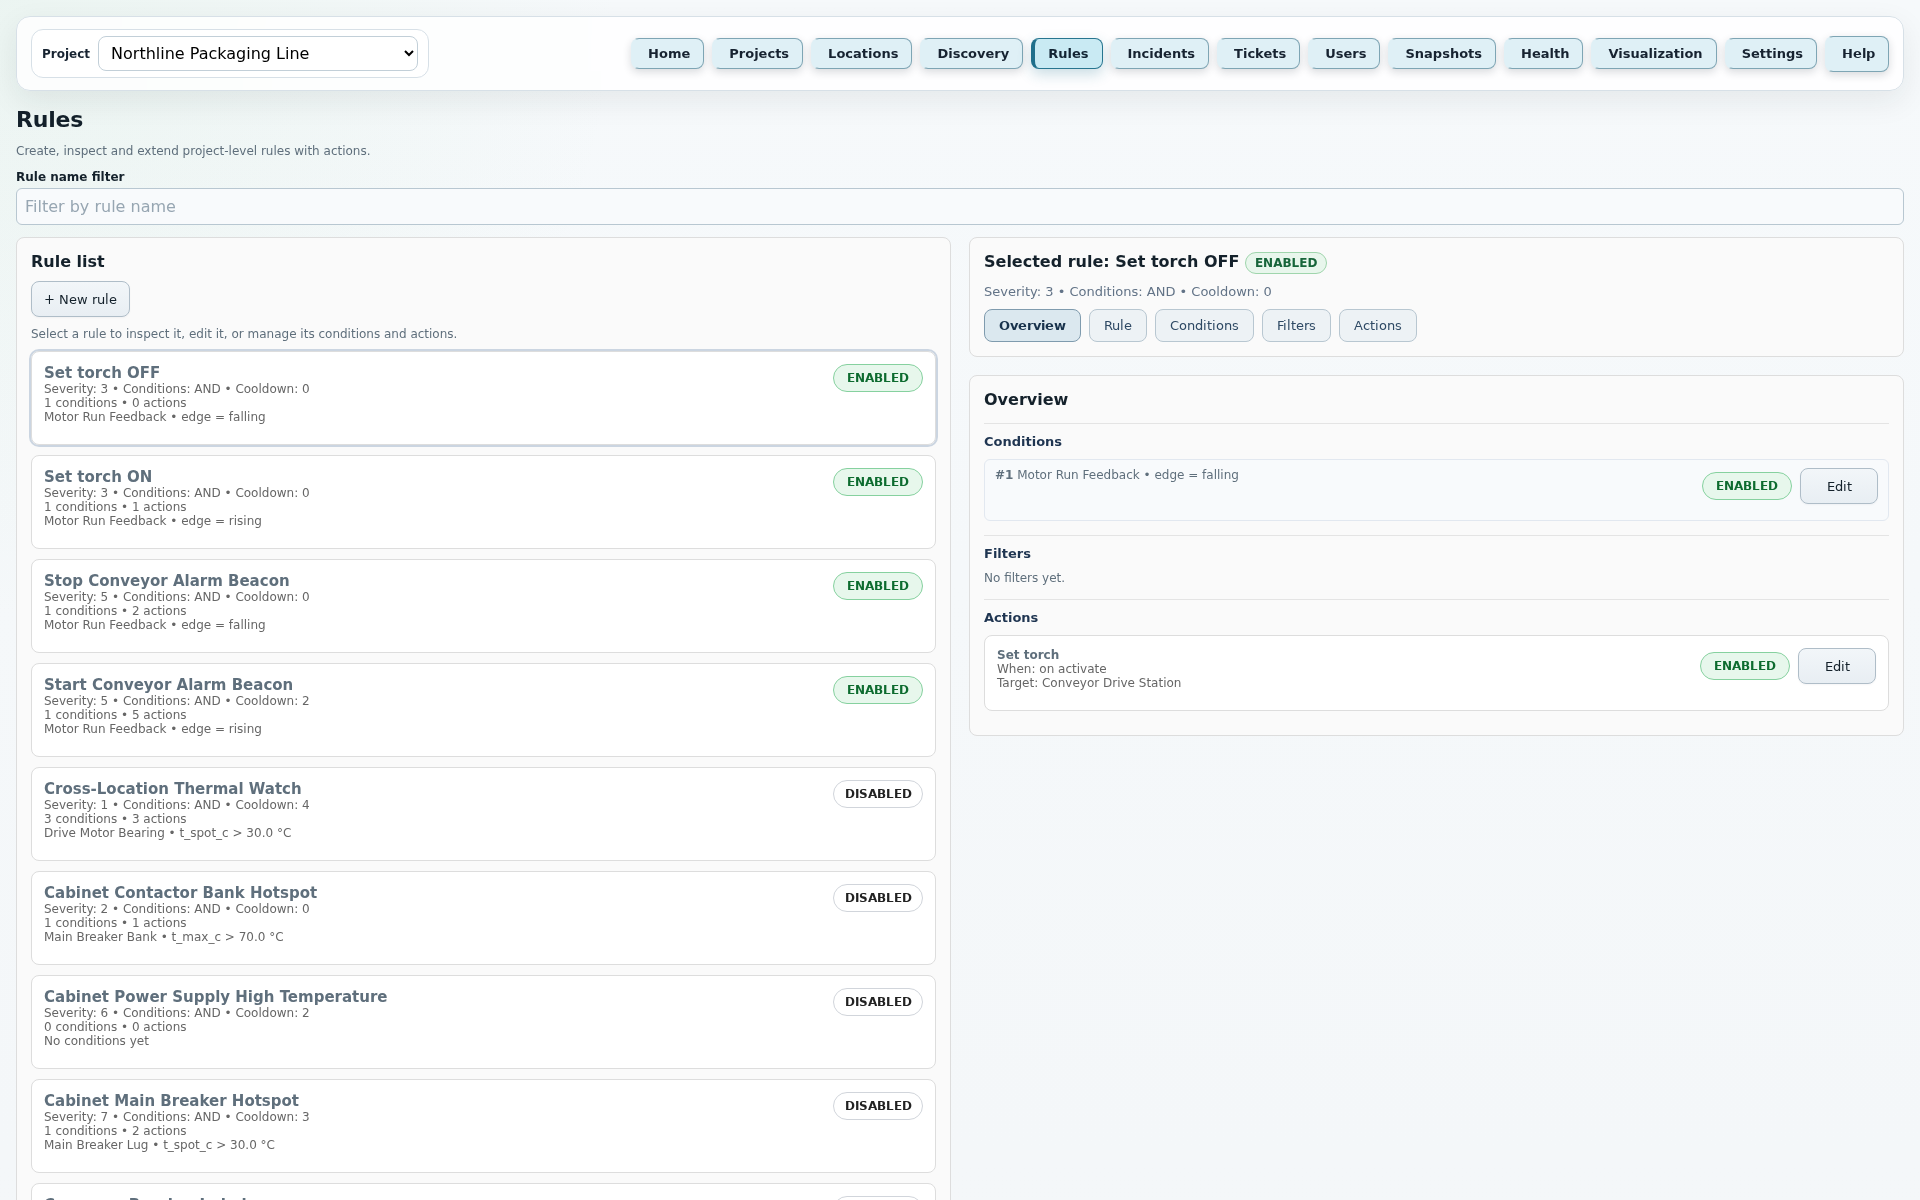
These points mirror the current application Help texts and describe the most important fields, buttons and runtime rules of this page.
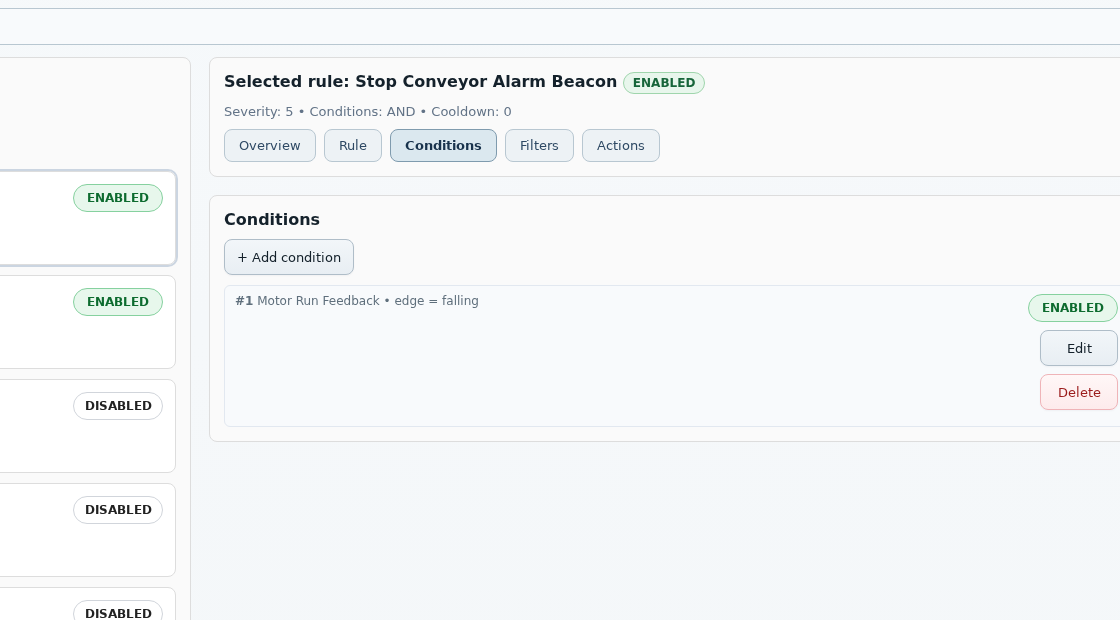
A Rule connects measurements, digital states, filters and actions into a traceable alarm decision. Operators can define when a state is relevant, when it is intentionally suppressed and which automatic response should follow.
Example: Box 2 - Maximum temperature > 80 °C. Optionally with 30 s threshold time and 2 °C hysteresis so short spikes do not immediately open an incident.
Example: |motor bearing left - motor bearing right| >= 12 °C. This makes unusual temperature differences between two ROIs visible.
Example: Average temperature rising by at least 5 °C within 60 s. This detects fast heating even before the absolute threshold is reached.
Example: DI 1 = on. This allows an external contact, switch or machine state to become part of the same alarm rule.
Example: DI 1 rising edge or falling edge. The rule reacts to a state transition, not only to the current state.
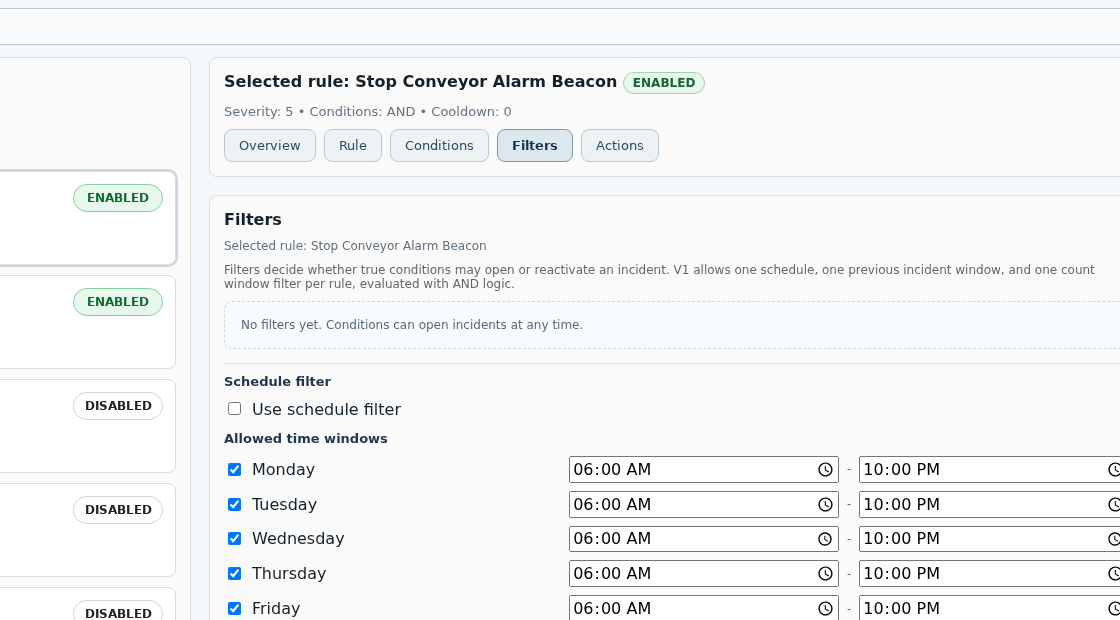
Active filters run after the conditions. They use AND logic: if any active filter blocks, no incident is opened and no action is executed. The fixed order is Schedule, Previous incident window, Count window.
Allows incidents only on defined weekdays and time windows. If the filter is active, unchecked days or times outside the window are blocked.
Can require that another rule has already triggered within a time window or has explicitly not triggered. This is useful for escalation or dependency logic.
Opens an incident only after the rule reaches a defined number of new activations within a time window. New false-to-true activations are counted, not every poll cycle.
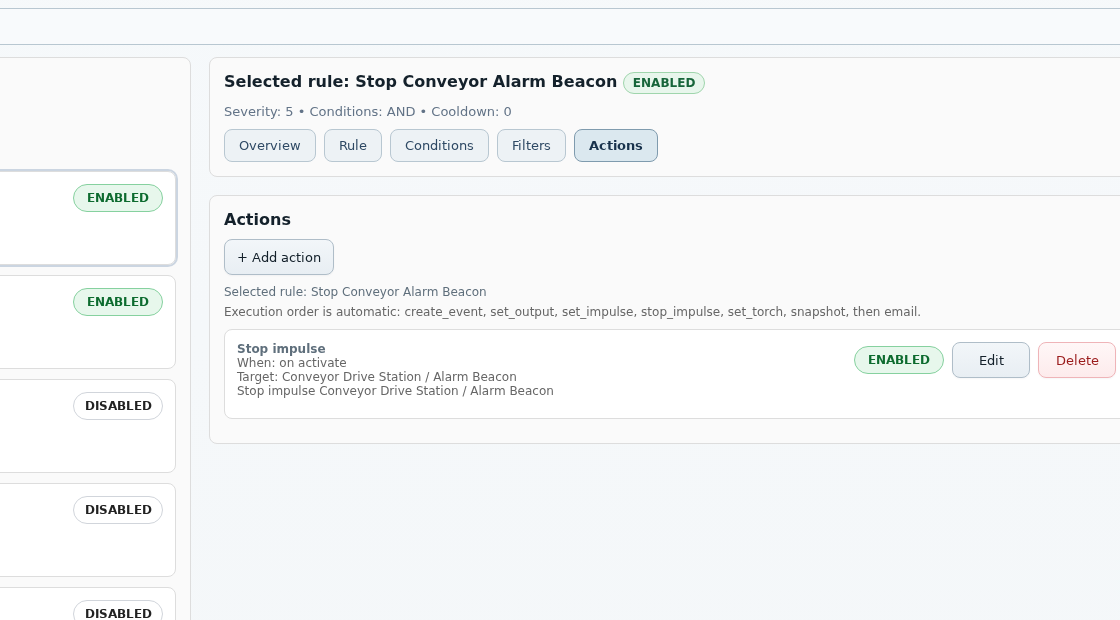
Actions are queued by the poller as an action job and executed by the action worker in a defined order: Create event, Set output, Set impulse, Stop impulse, Set torch, Snapshot, then Email. If Set torch follows a successfully started Set impulse in the same action run, the worker waits 500 ms before the AX8 web API call. SMTP failures or later action failures do not automatically undo earlier actions; jobs with write_error or resolve_error finish as done_with_errors.
Writes a structured rule event with message and optional tags.
Sets a digital output permanently to on or off. Supports execution on activation and on clear if that response is desired.
Switches a digital output briefly to on or off as one or more timed pulses, optionally pauses between pulses and then resets it automatically.
Shortens the selected digital output's running impulse sequence so it finishes after at most one more pulse.
Switches the camera LED torch on or off at a selected location.
Schedules a DB-backed snapshot job for a location in the project. Trigger states and ROI values remain traceable as evidence while the snapshot worker captures the image asynchronously.
Sends an alarm e-mail to configured recipients. Subject and body can use templates; context such as rule, incident, camera IP, condition results, relevant ROI values and configured actions is appended automatically.
The small screenshots show the main working areas of the Rules page: Rule, Conditions, Filters and Actions.
JC Thermal Monitor
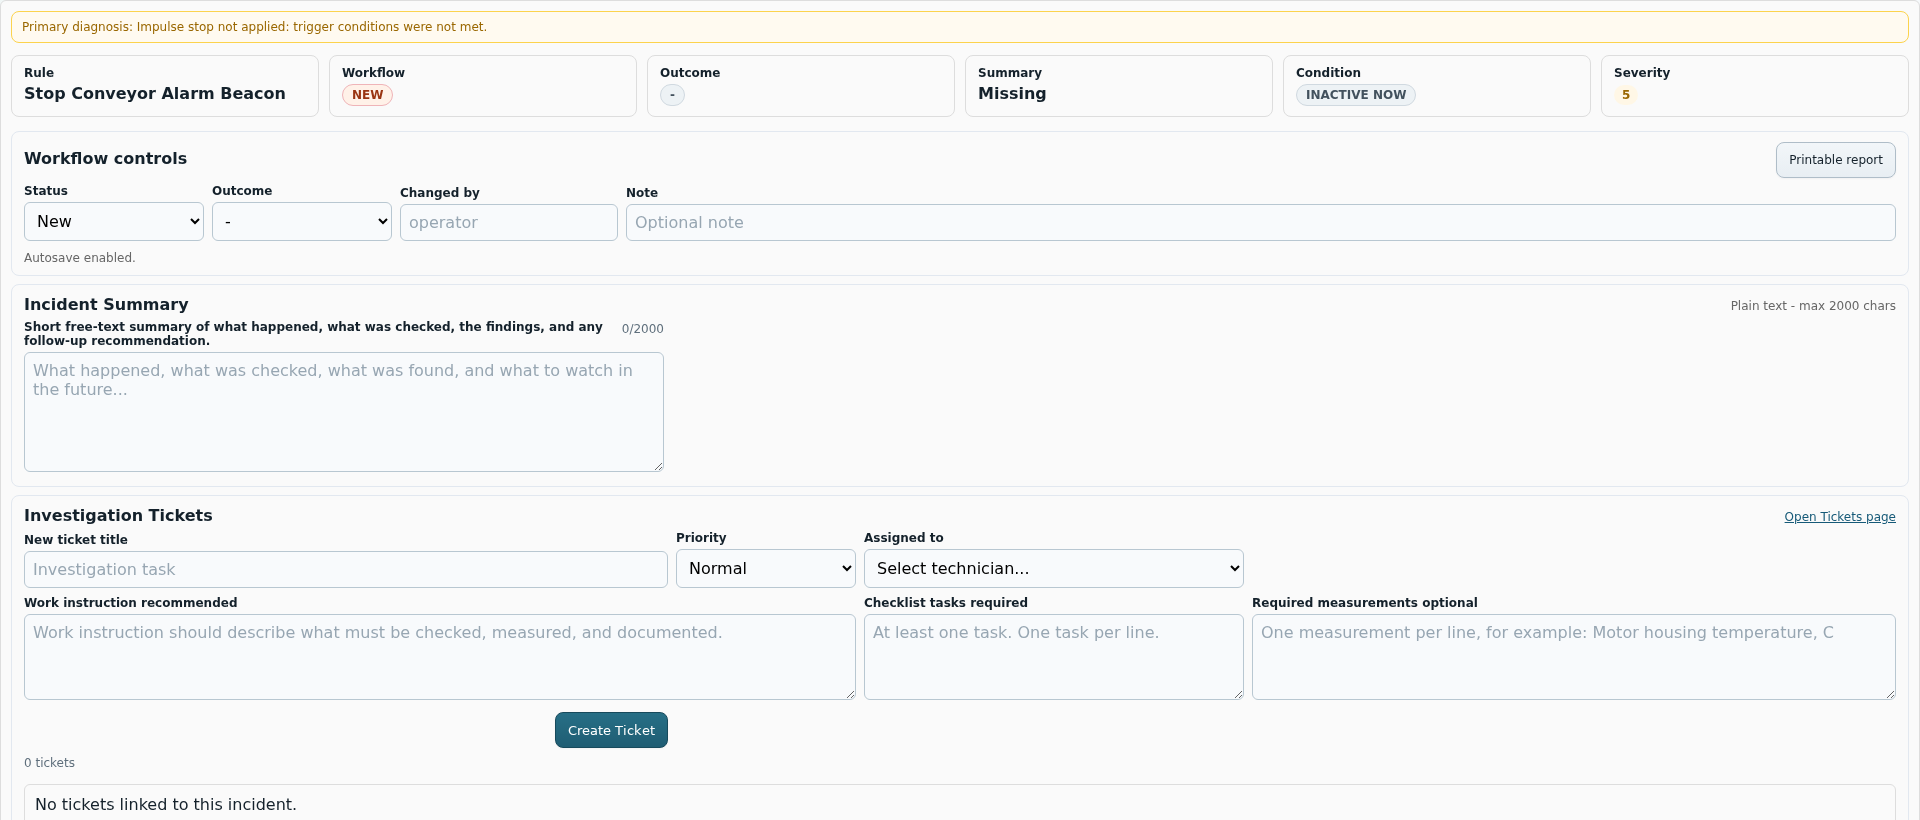
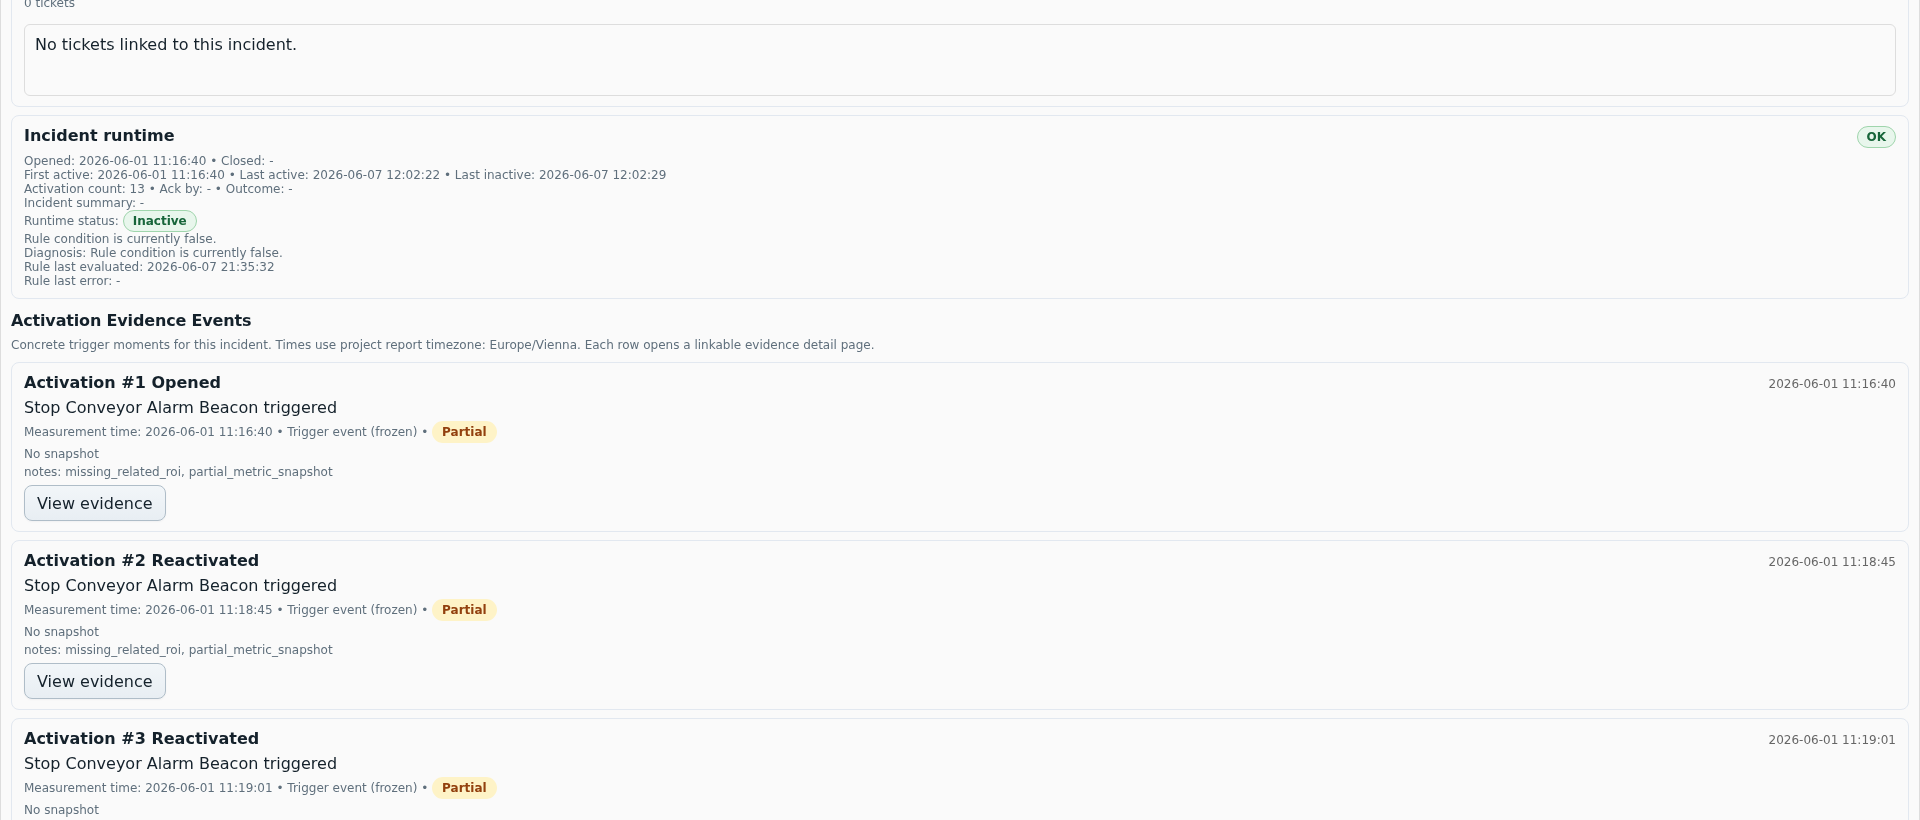
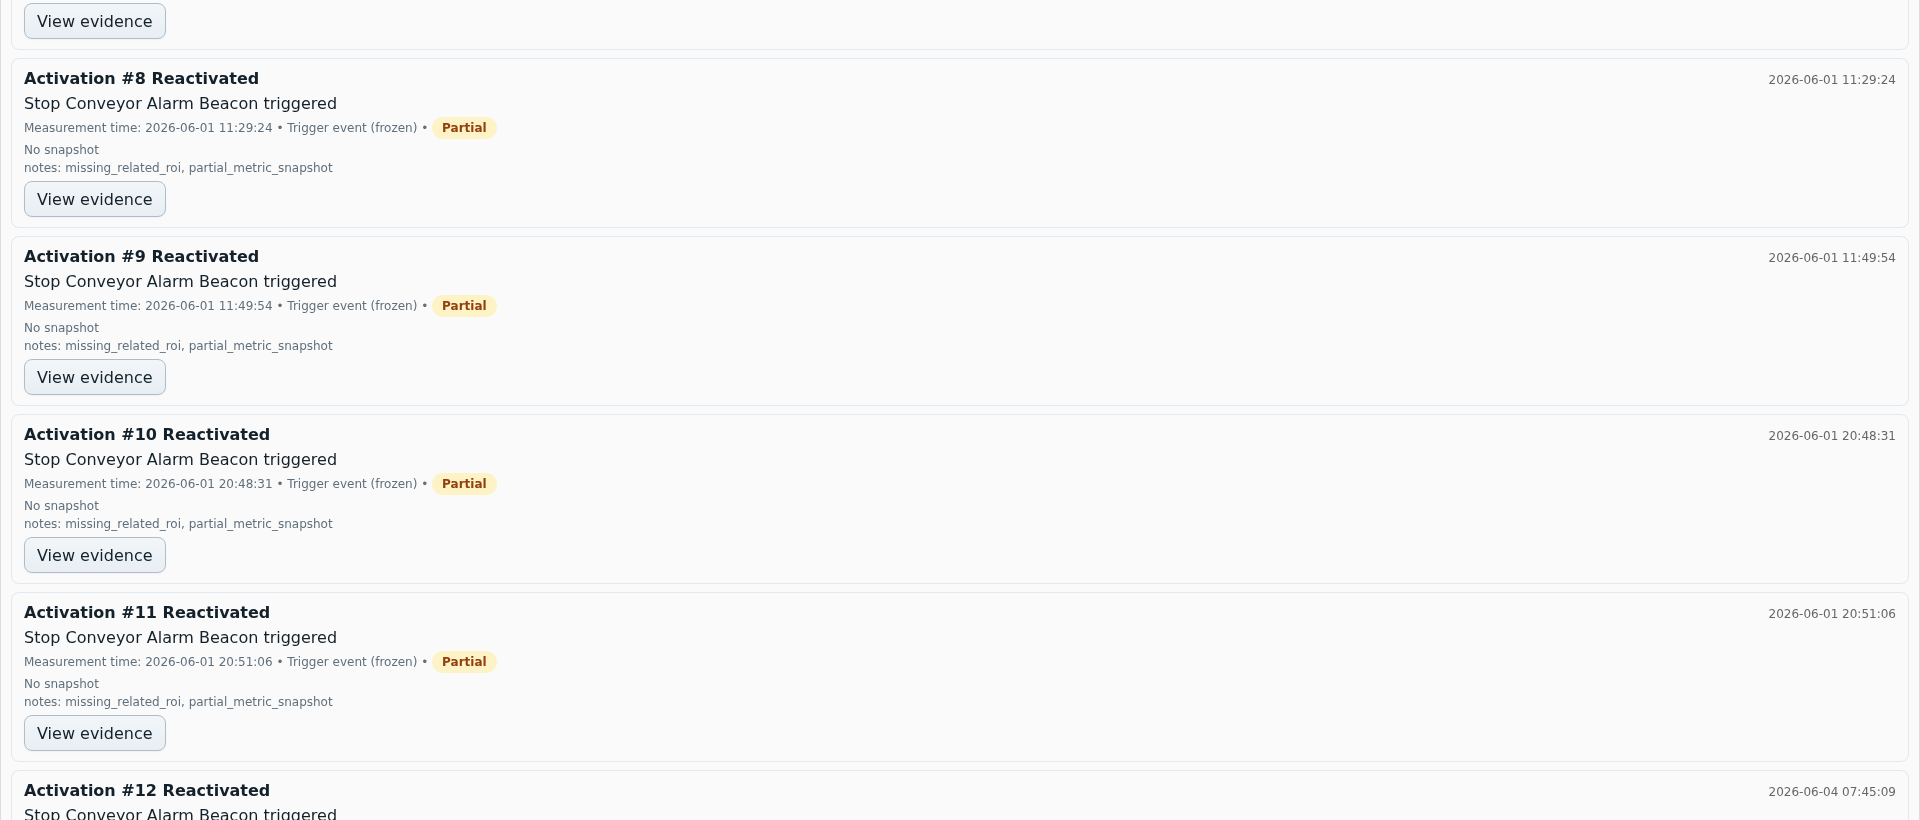
Incidents turns a technical alarm into a traceable case. Operators see what triggered, what has already been acknowledged and which evidence is available.
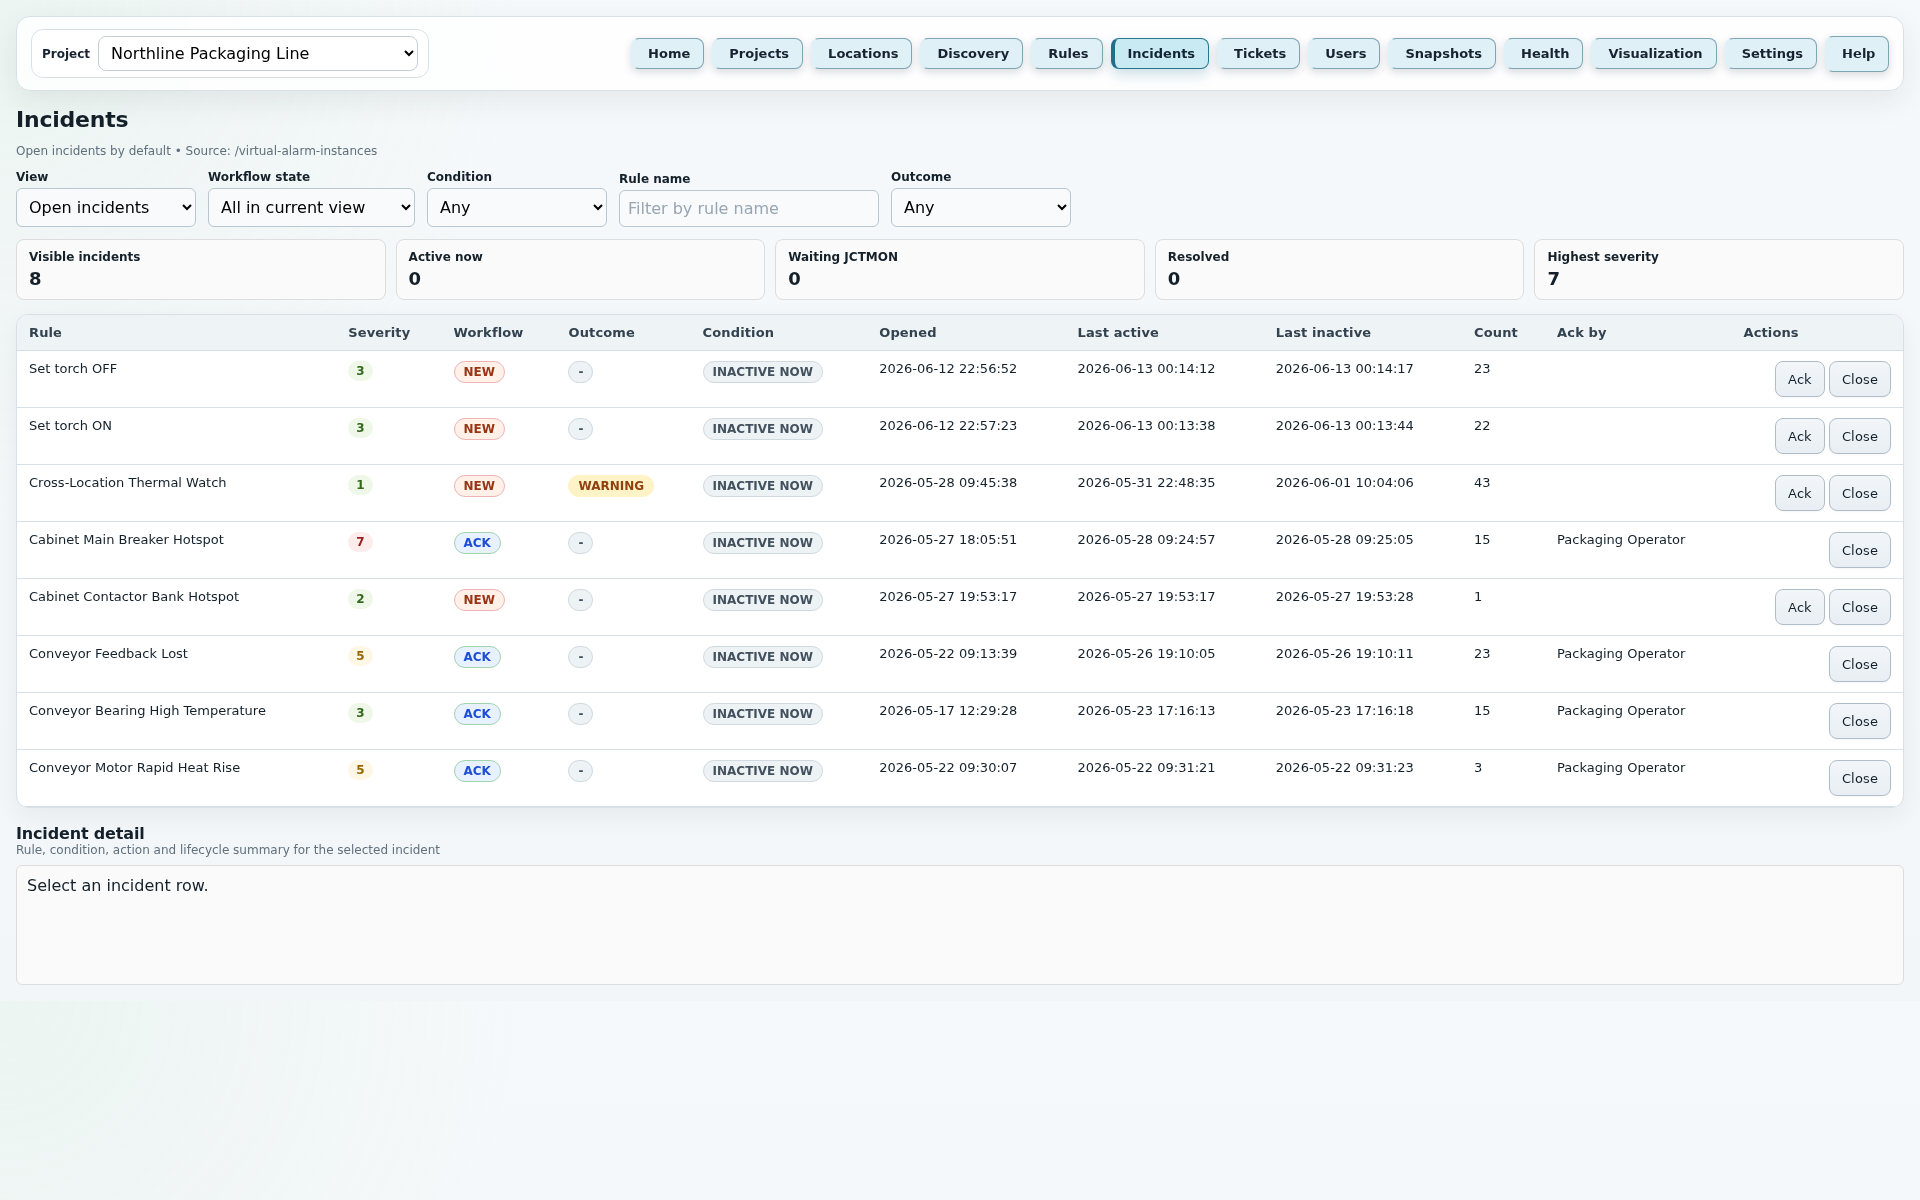
These points mirror the current application Help texts and describe the most important fields, buttons and runtime rules of this page.
The detail images show what appears after selecting an incident: workflow, runtime, evidence and lifecycle records.
JC Thermal Monitor
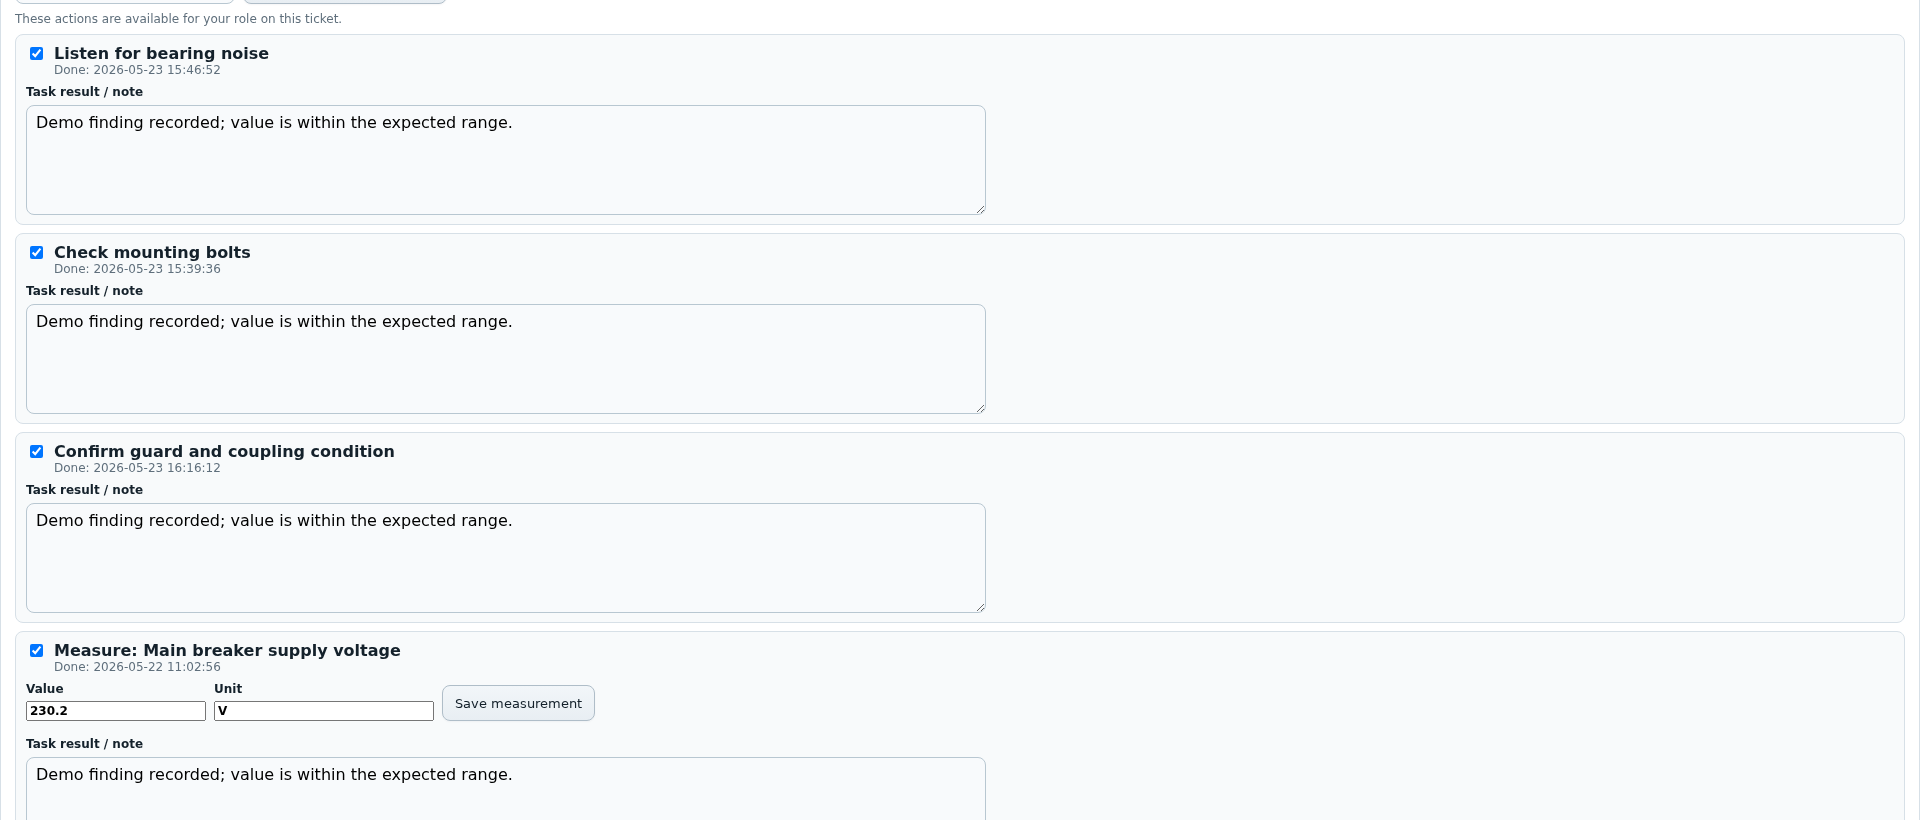
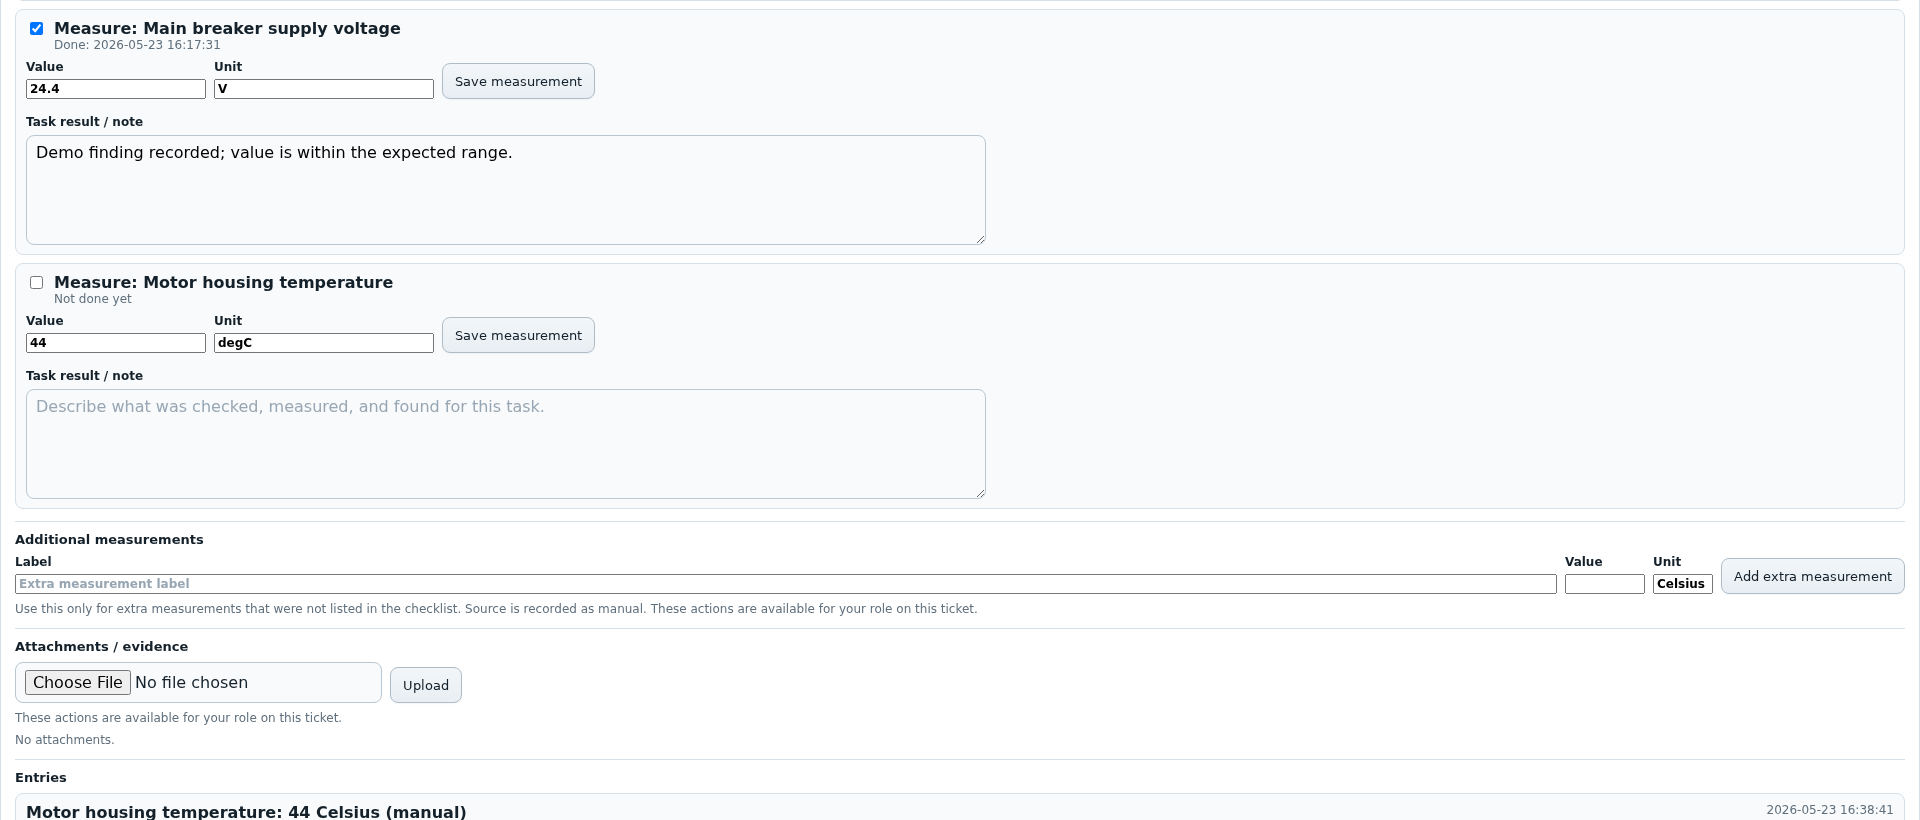
Tickets extends incidents with simple work handling. Operators can hand investigation tasks to technicians, review results and close tickets.
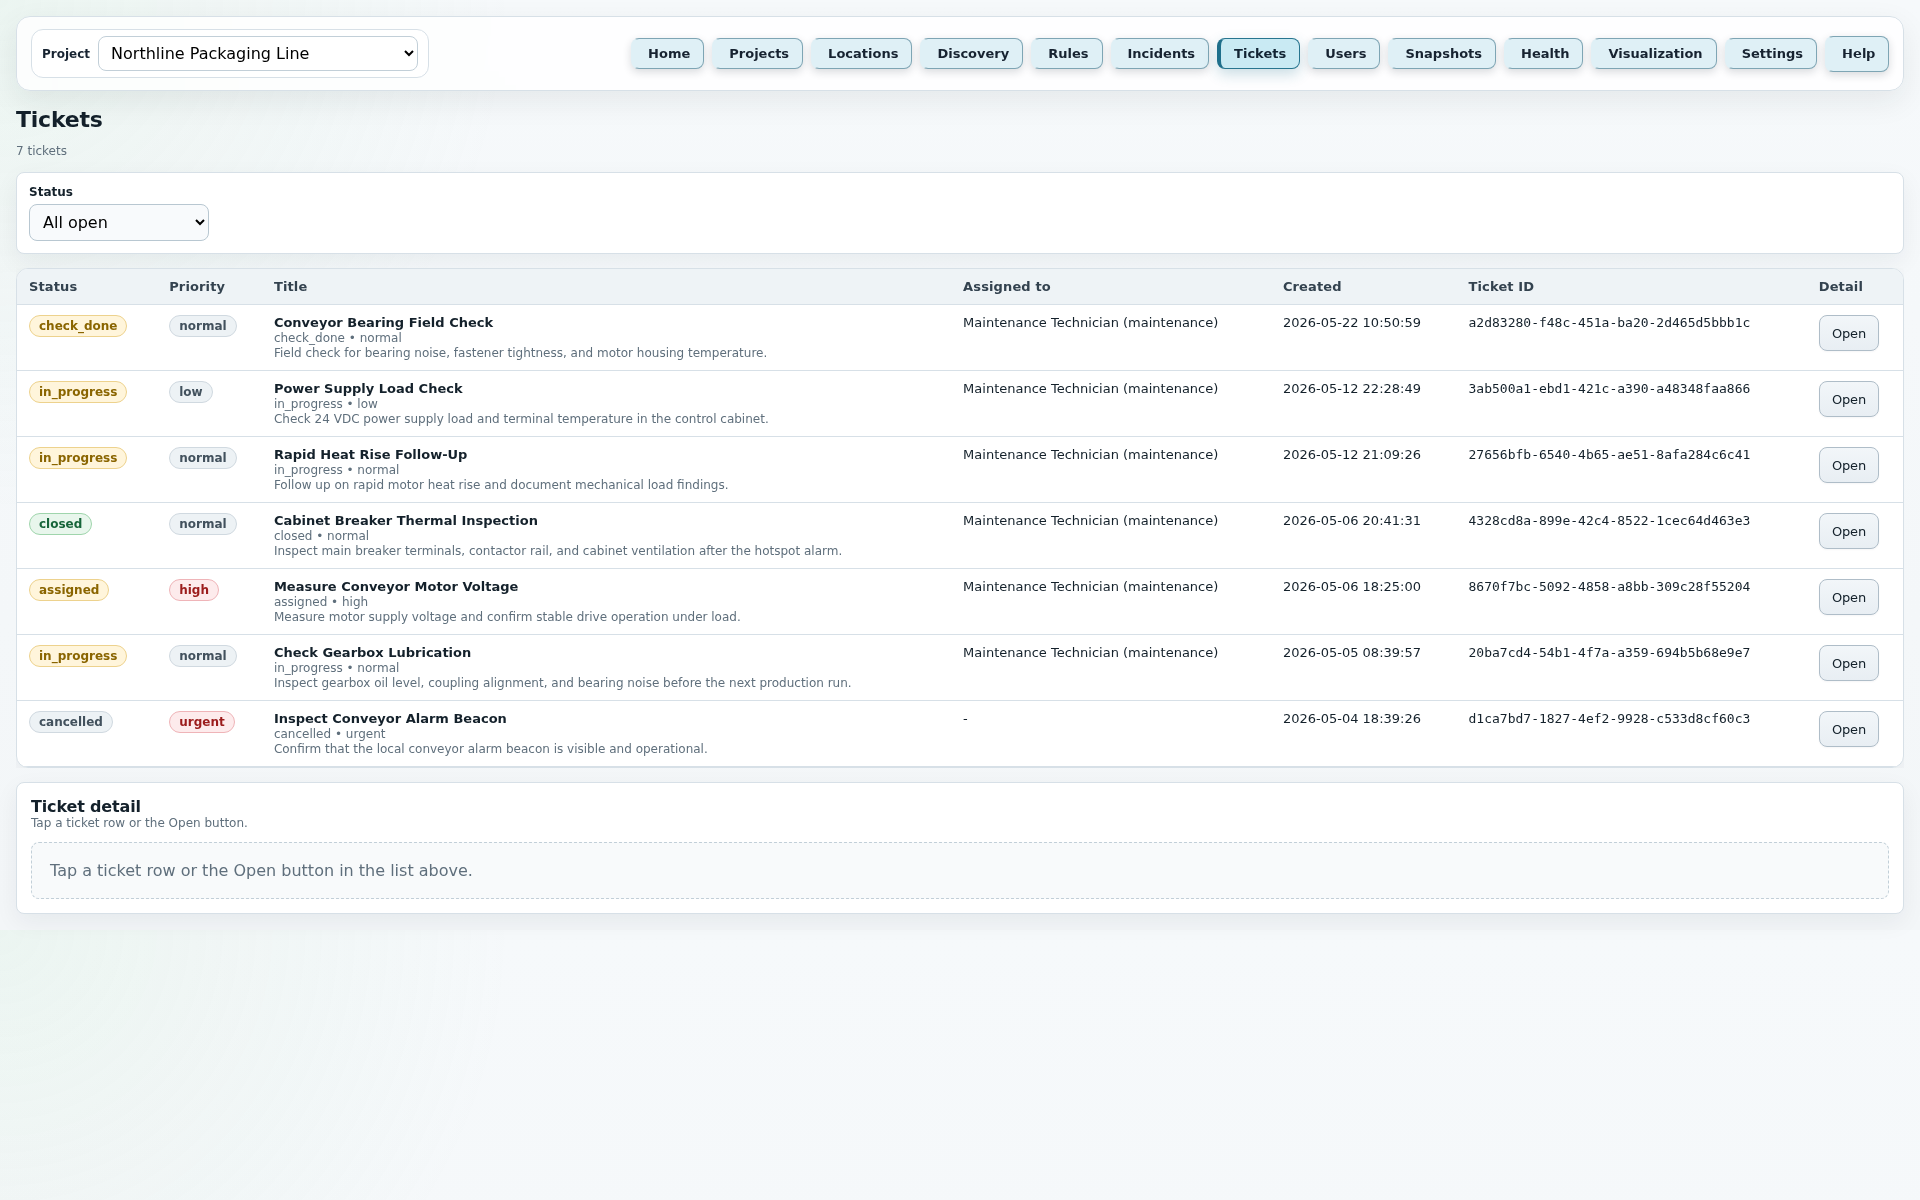
These points mirror the current application Help texts and describe the most important fields, buttons and runtime rules of this page.
The detail images complement the large ticket view with checklist, measurements, notes and history.
JC Thermal Monitor
The Users page manages the role-based user administration of JC Thermal Monitor. Viewers, operators, technicians and admins are created and maintained so operation, ticket work and protected system functions remain role-based.
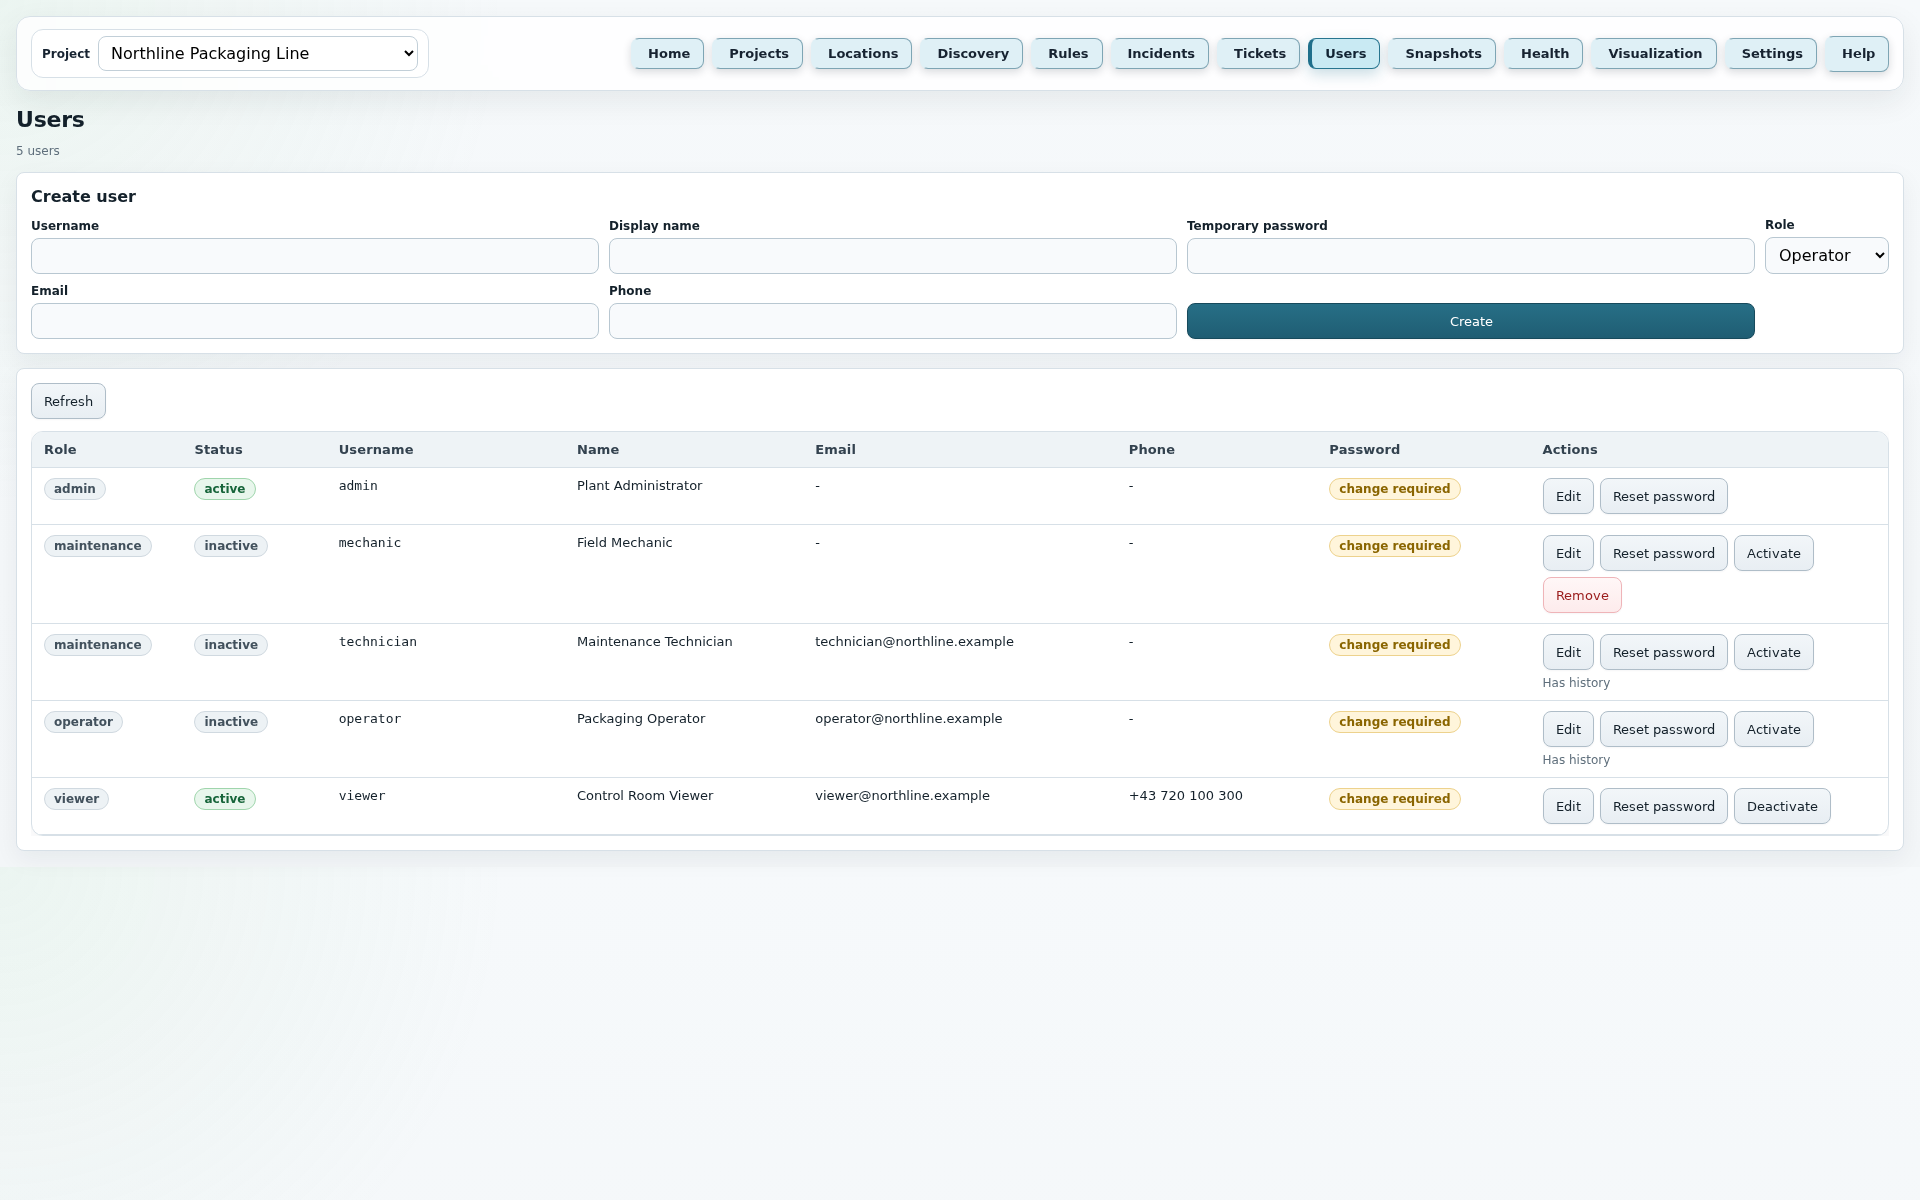
Users describes the role-based user administration in JC Thermal Monitor. The page is deliberately administrative: it defines who may configure the system, who works tickets, who may only monitor and which accounts must be retained for security or history reasons.
Manages users, roles, password resets, active state and dangerous cleanup actions. Admins can operate configuration, incidents, tickets and protected system functions.
Runs the normal plant workflow: monitoring, configuration, rules, incidents, snapshots, reports and ticket review within the allowed project context.
Works assigned investigation tickets and documents work steps, measurements, notes and attachments. Technicians do not finally close tickets themselves.
Is intended for read-only monitor views. Viewers can monitor Home and Visualization, but cannot change configuration, tickets or outputs.
Reloads the user list, including inactive users. This is useful after changes or when several admins are working.
Switches a table row into edit mode. Name, Email, Phone and Role can be edited; Username remains unchanged.
Saves the profile fields or role changed in edit mode. The last active admin remains protected.
Discards the currently displayed edit state and returns the row to read mode.
Sets a new temporary password and forces a password change on the next login.
Blocks login while keeping historical ticket and workflow references. The current active user and the last active admin are protected.
Re-enables an inactive user so they can log in again and use their role.
Permanently deletes only inactive users without database history. Users referenced by tickets or workflows remain deactivated instead of deleted.
JC Thermal Monitor
Snapshots provides the image evidence for measurements and incidents. Manual and rule-based snapshots are stored, linked and displayed with annotations when needed.
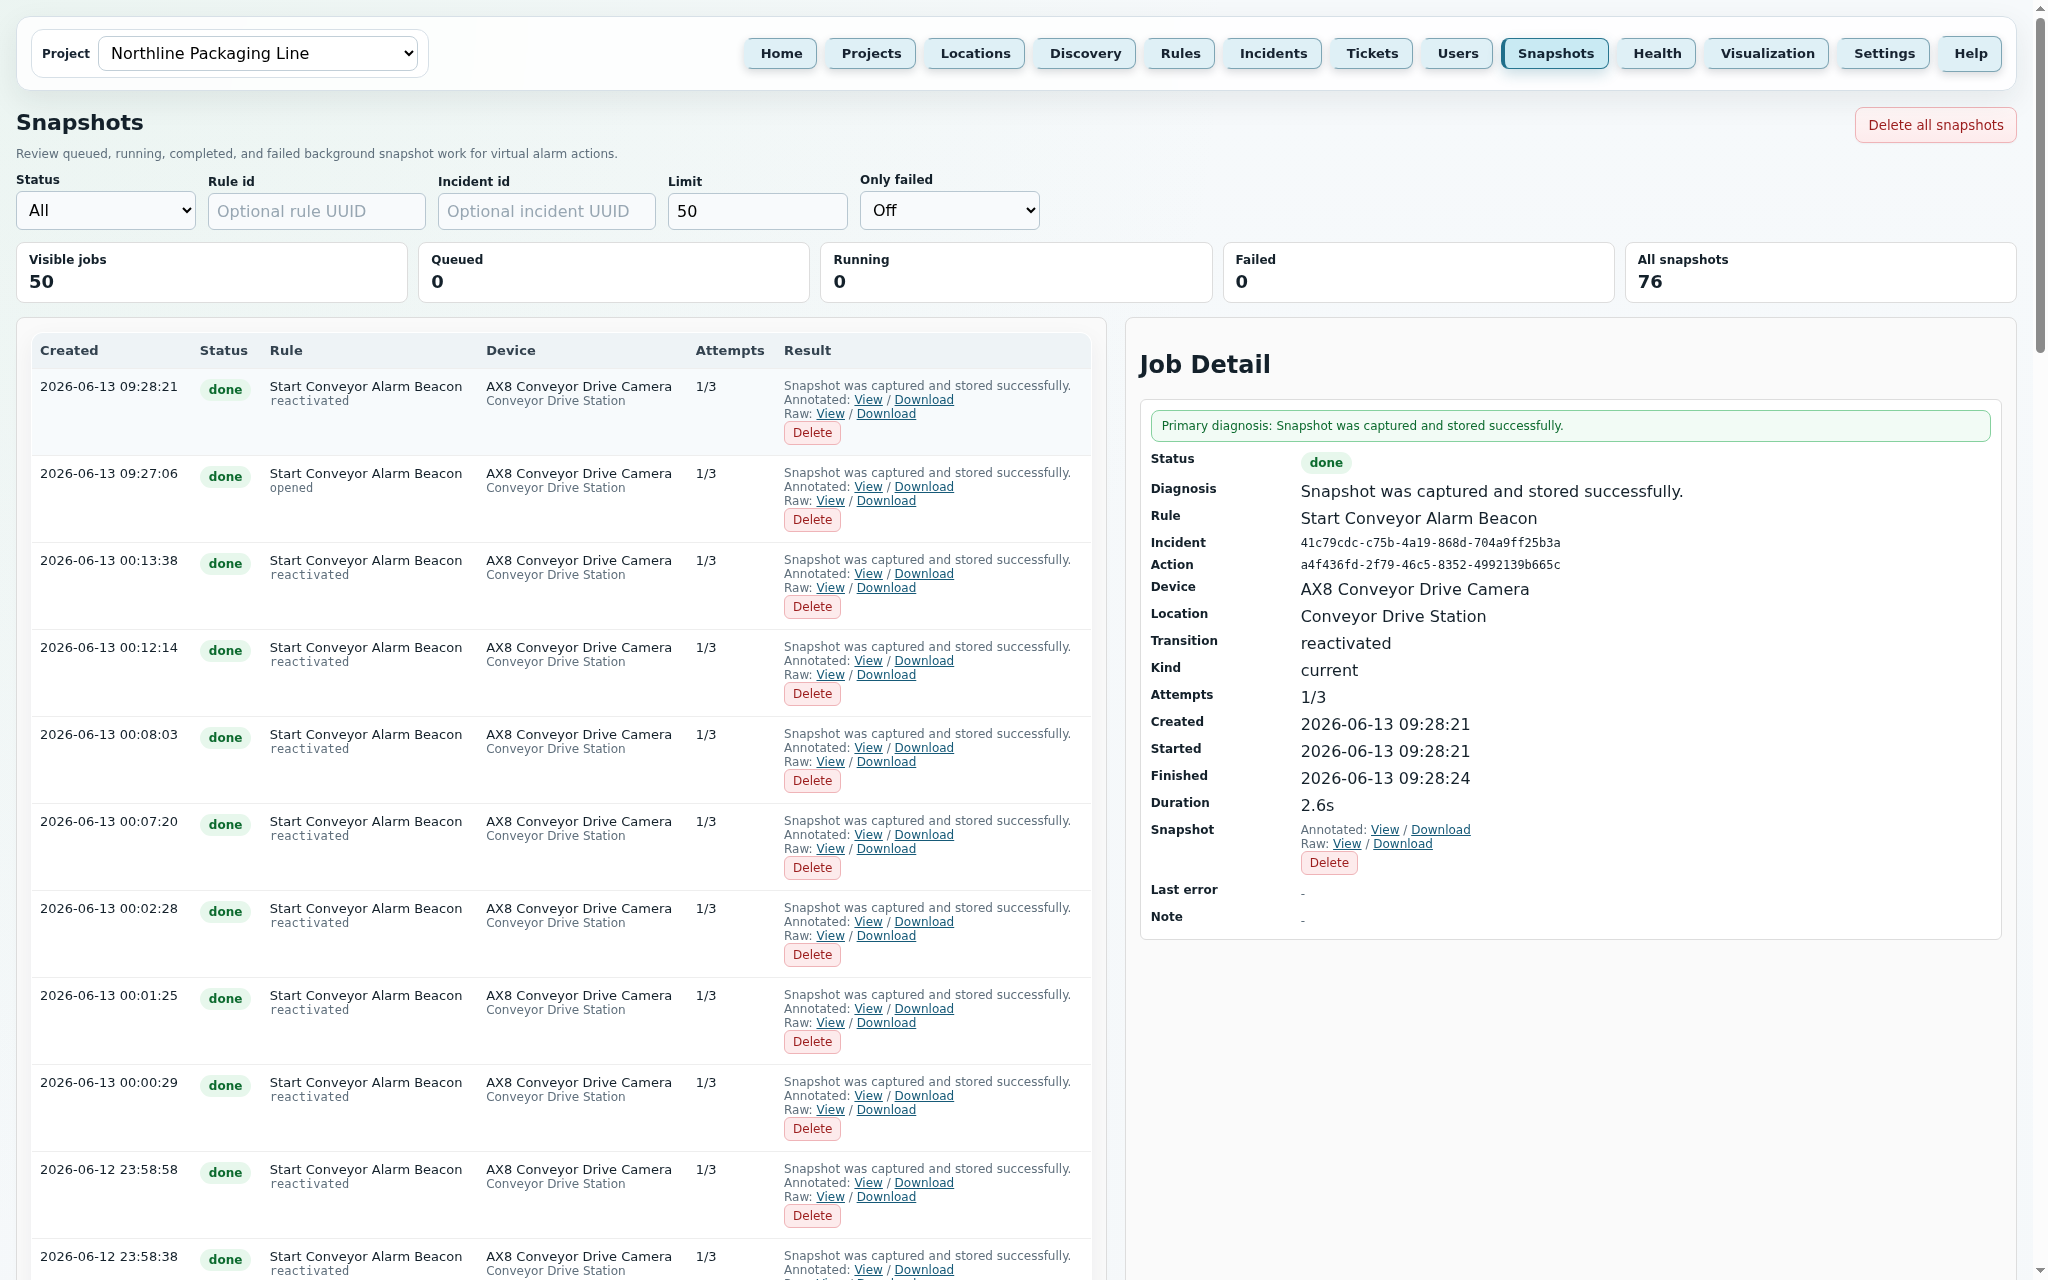
These points mirror the current application Help texts and describe the most important fields, buttons and runtime rules of this page.
JC Thermal Monitor
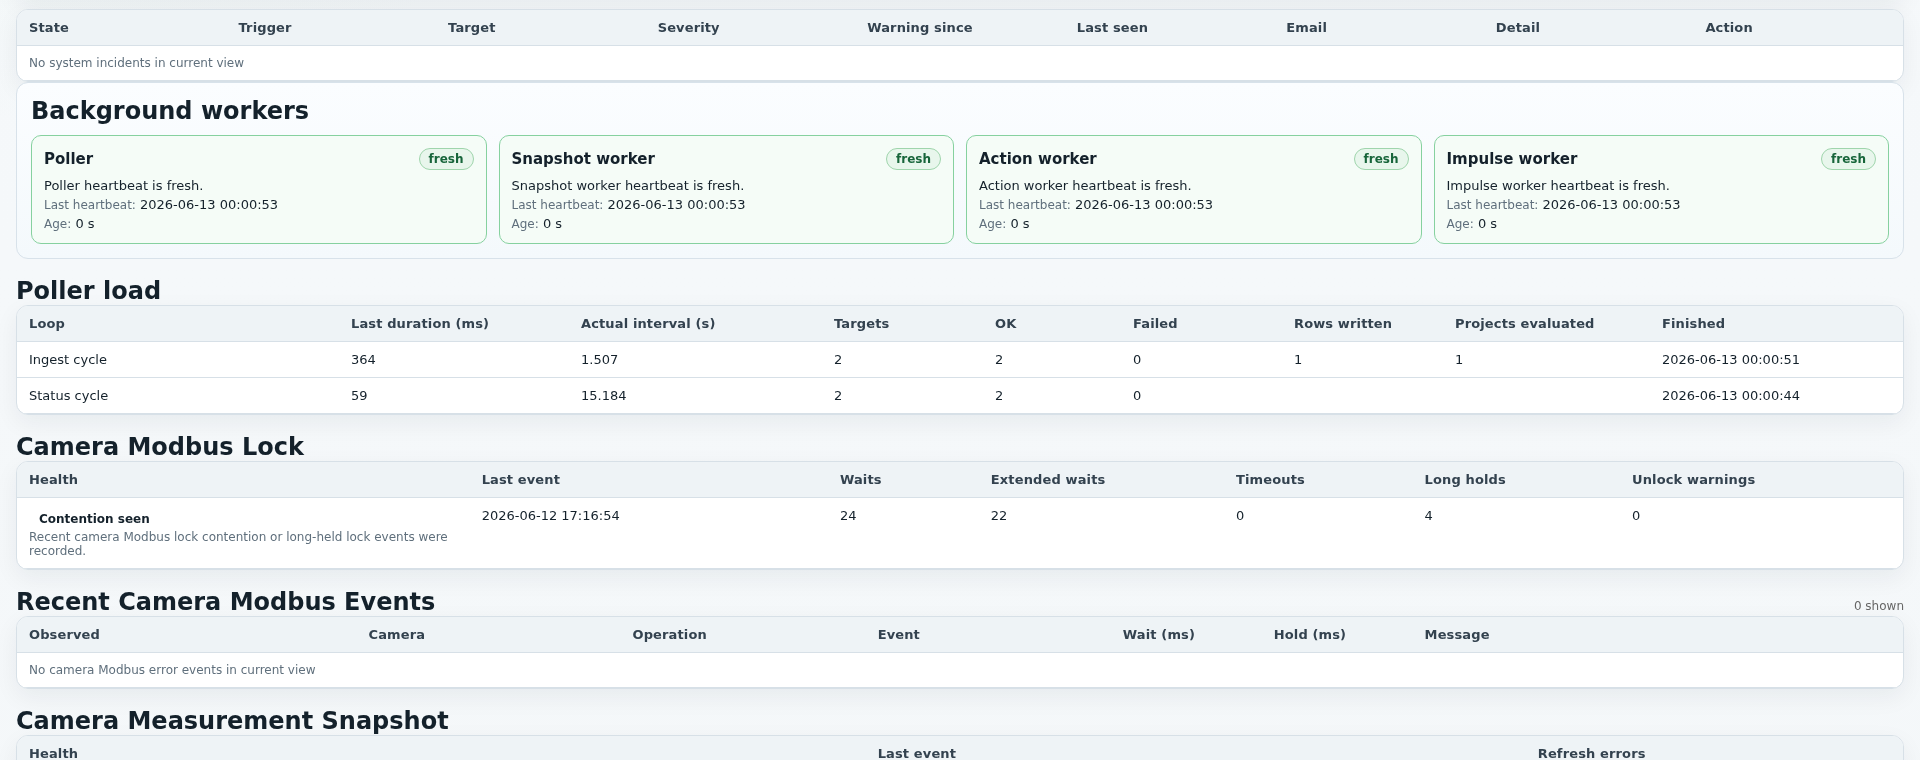
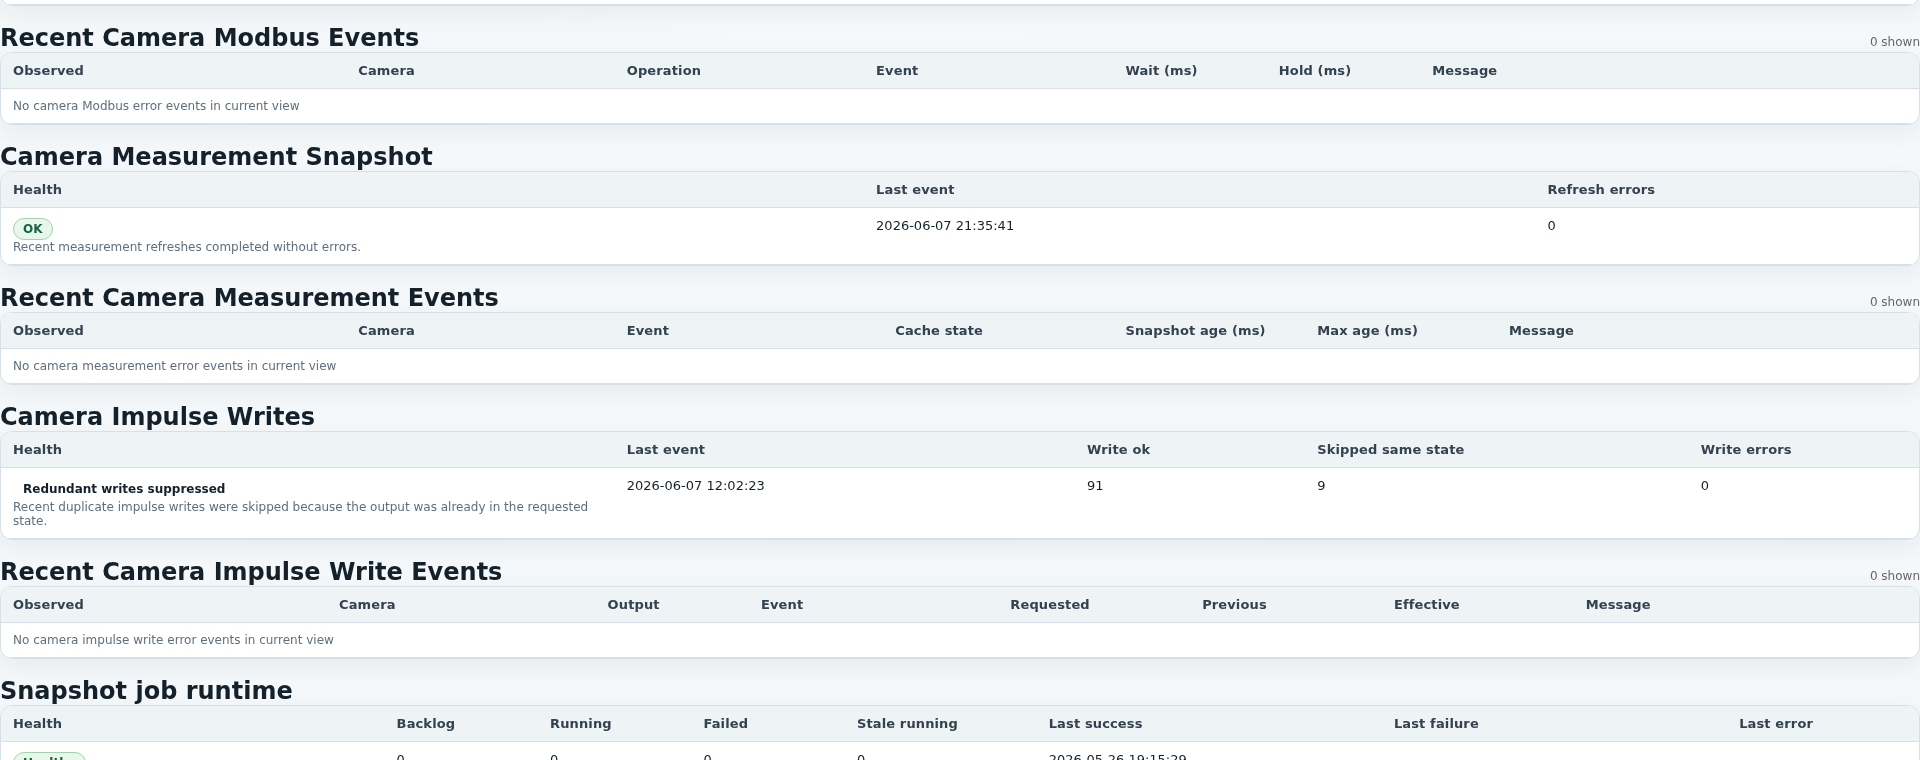
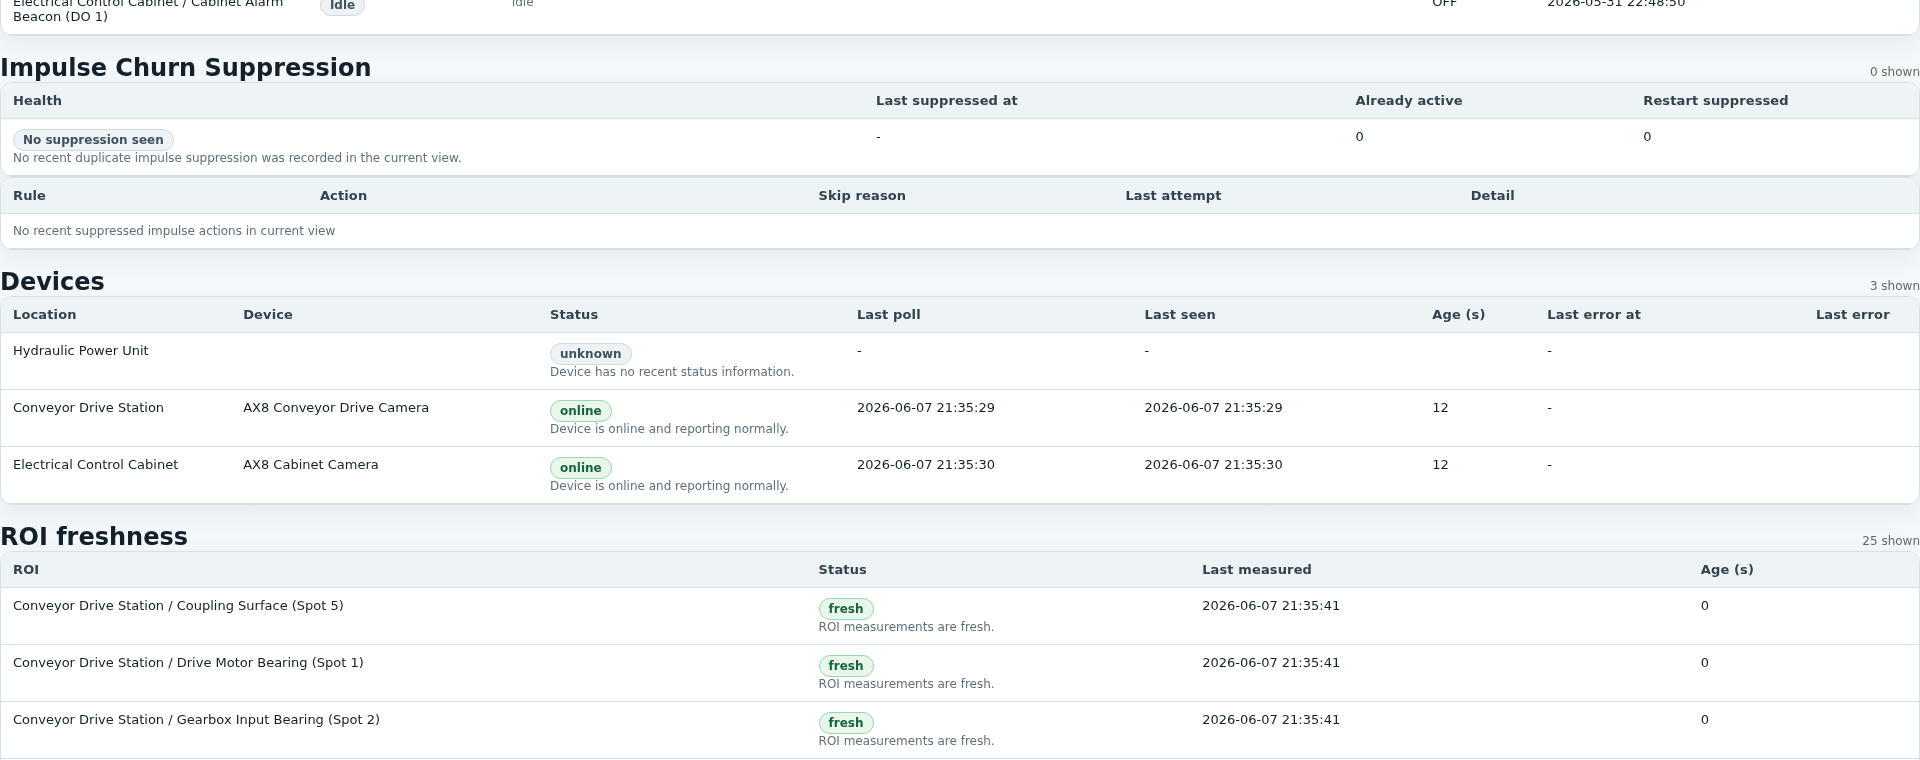
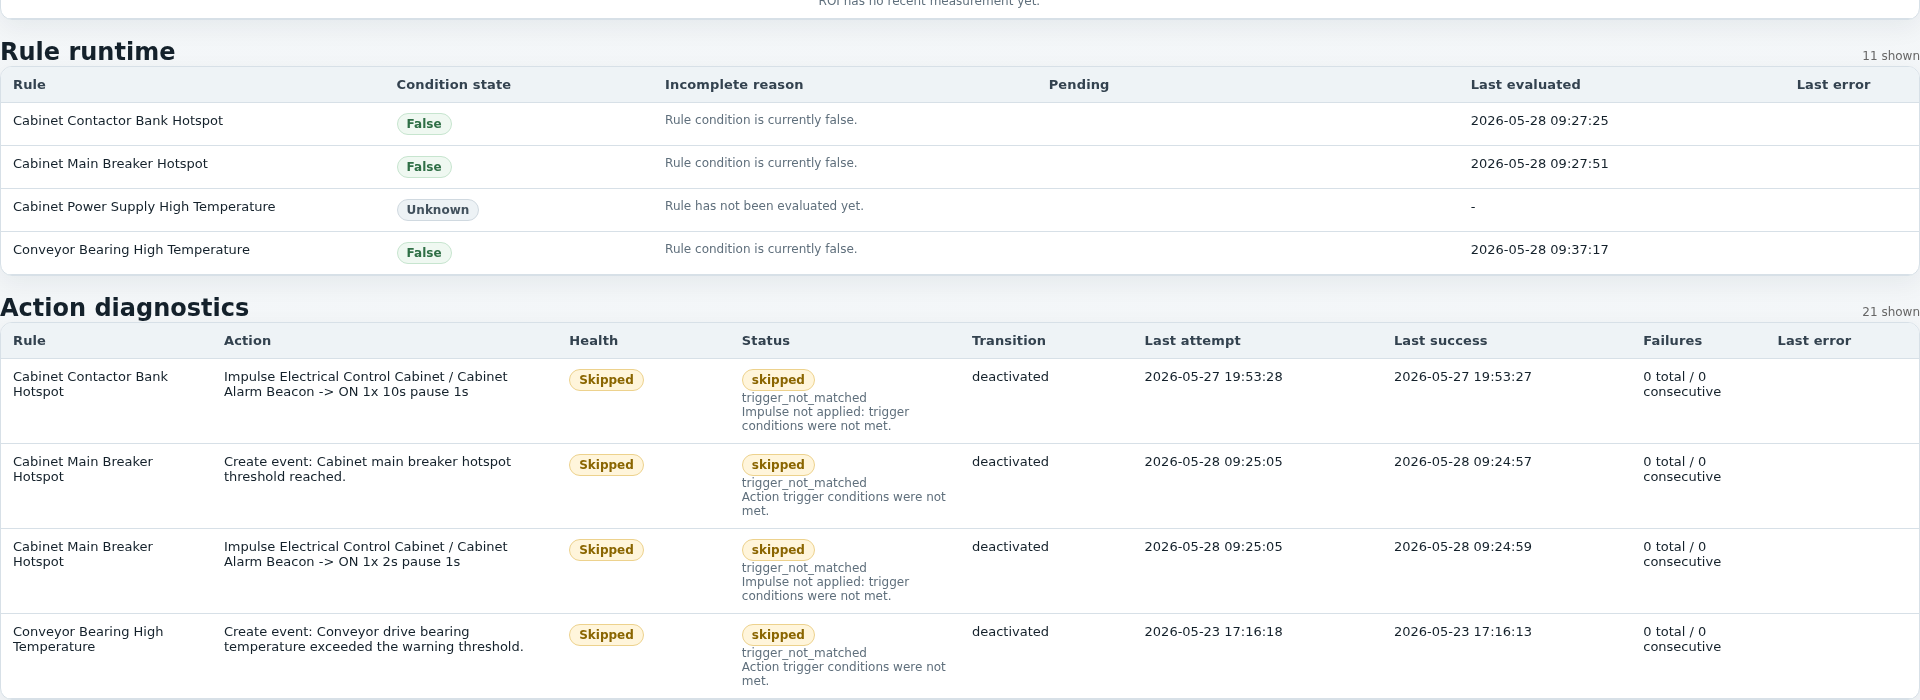
Health shows not only whether the web application is running, but whether the entire monitoring operation is fresh, plausible and complete.
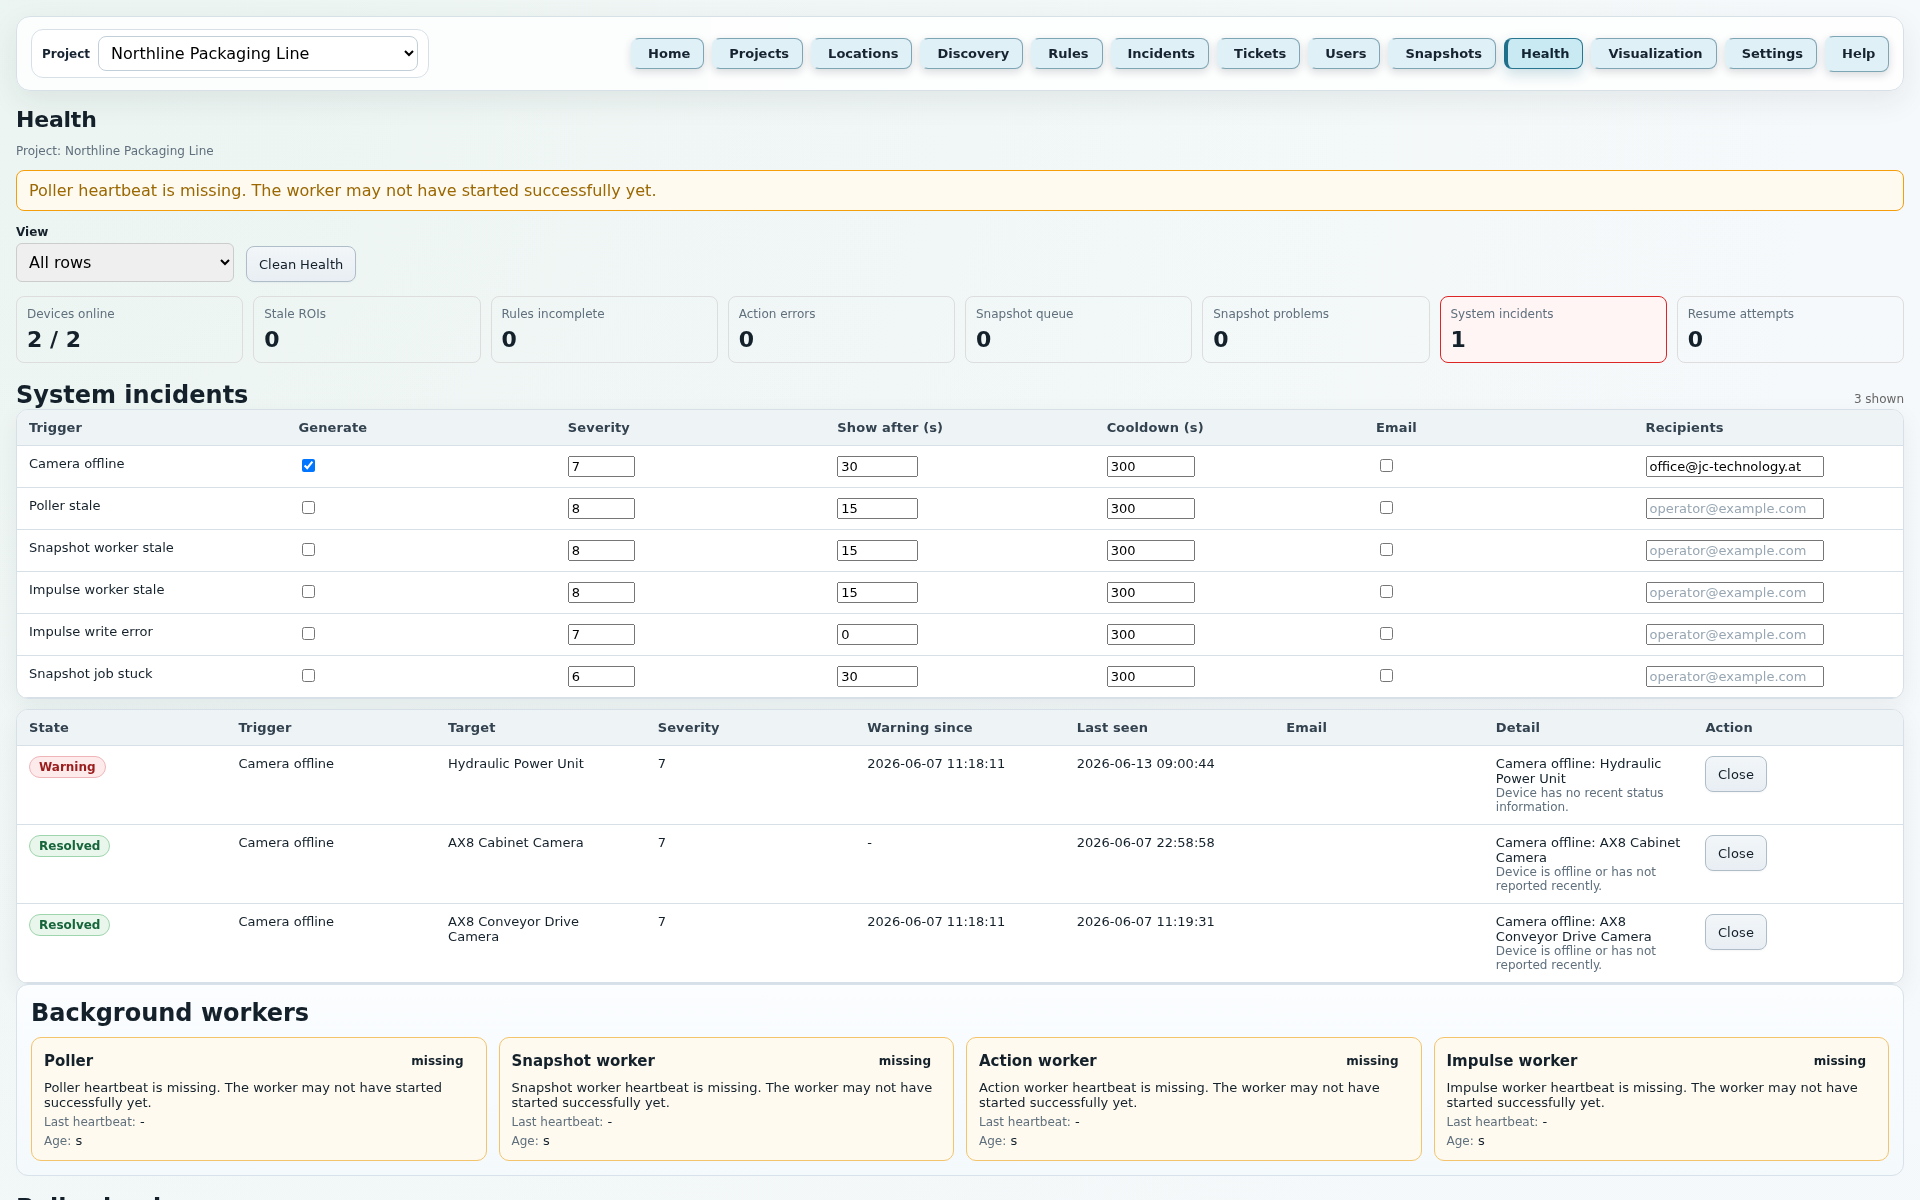
These points mirror the current application Help texts and describe the most important fields, buttons and runtime rules of this page.
The detail images complement the large Health view with workers, poller/camera runtime and rule/action diagnostics.
JC Thermal Monitor
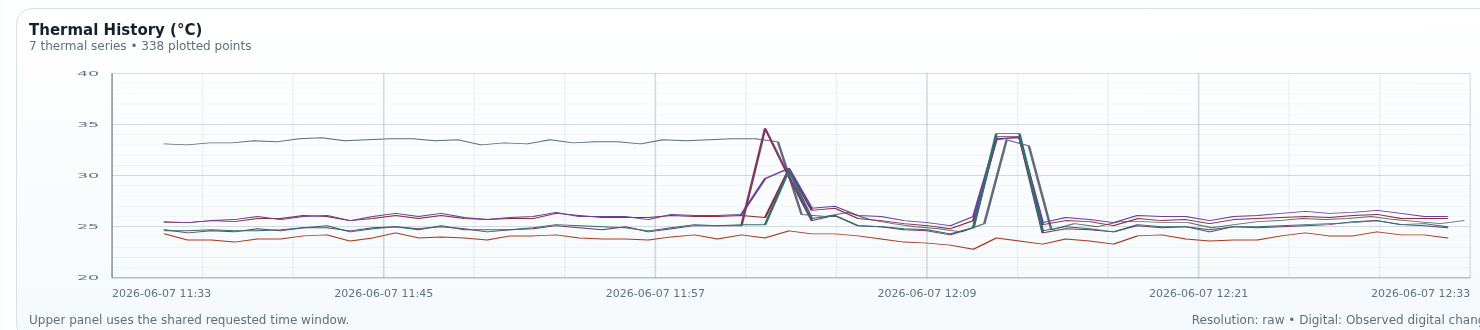
The Visualization page is used for analysis. Users can compare thermal measurement series, incident activations and digital states in the same time window.
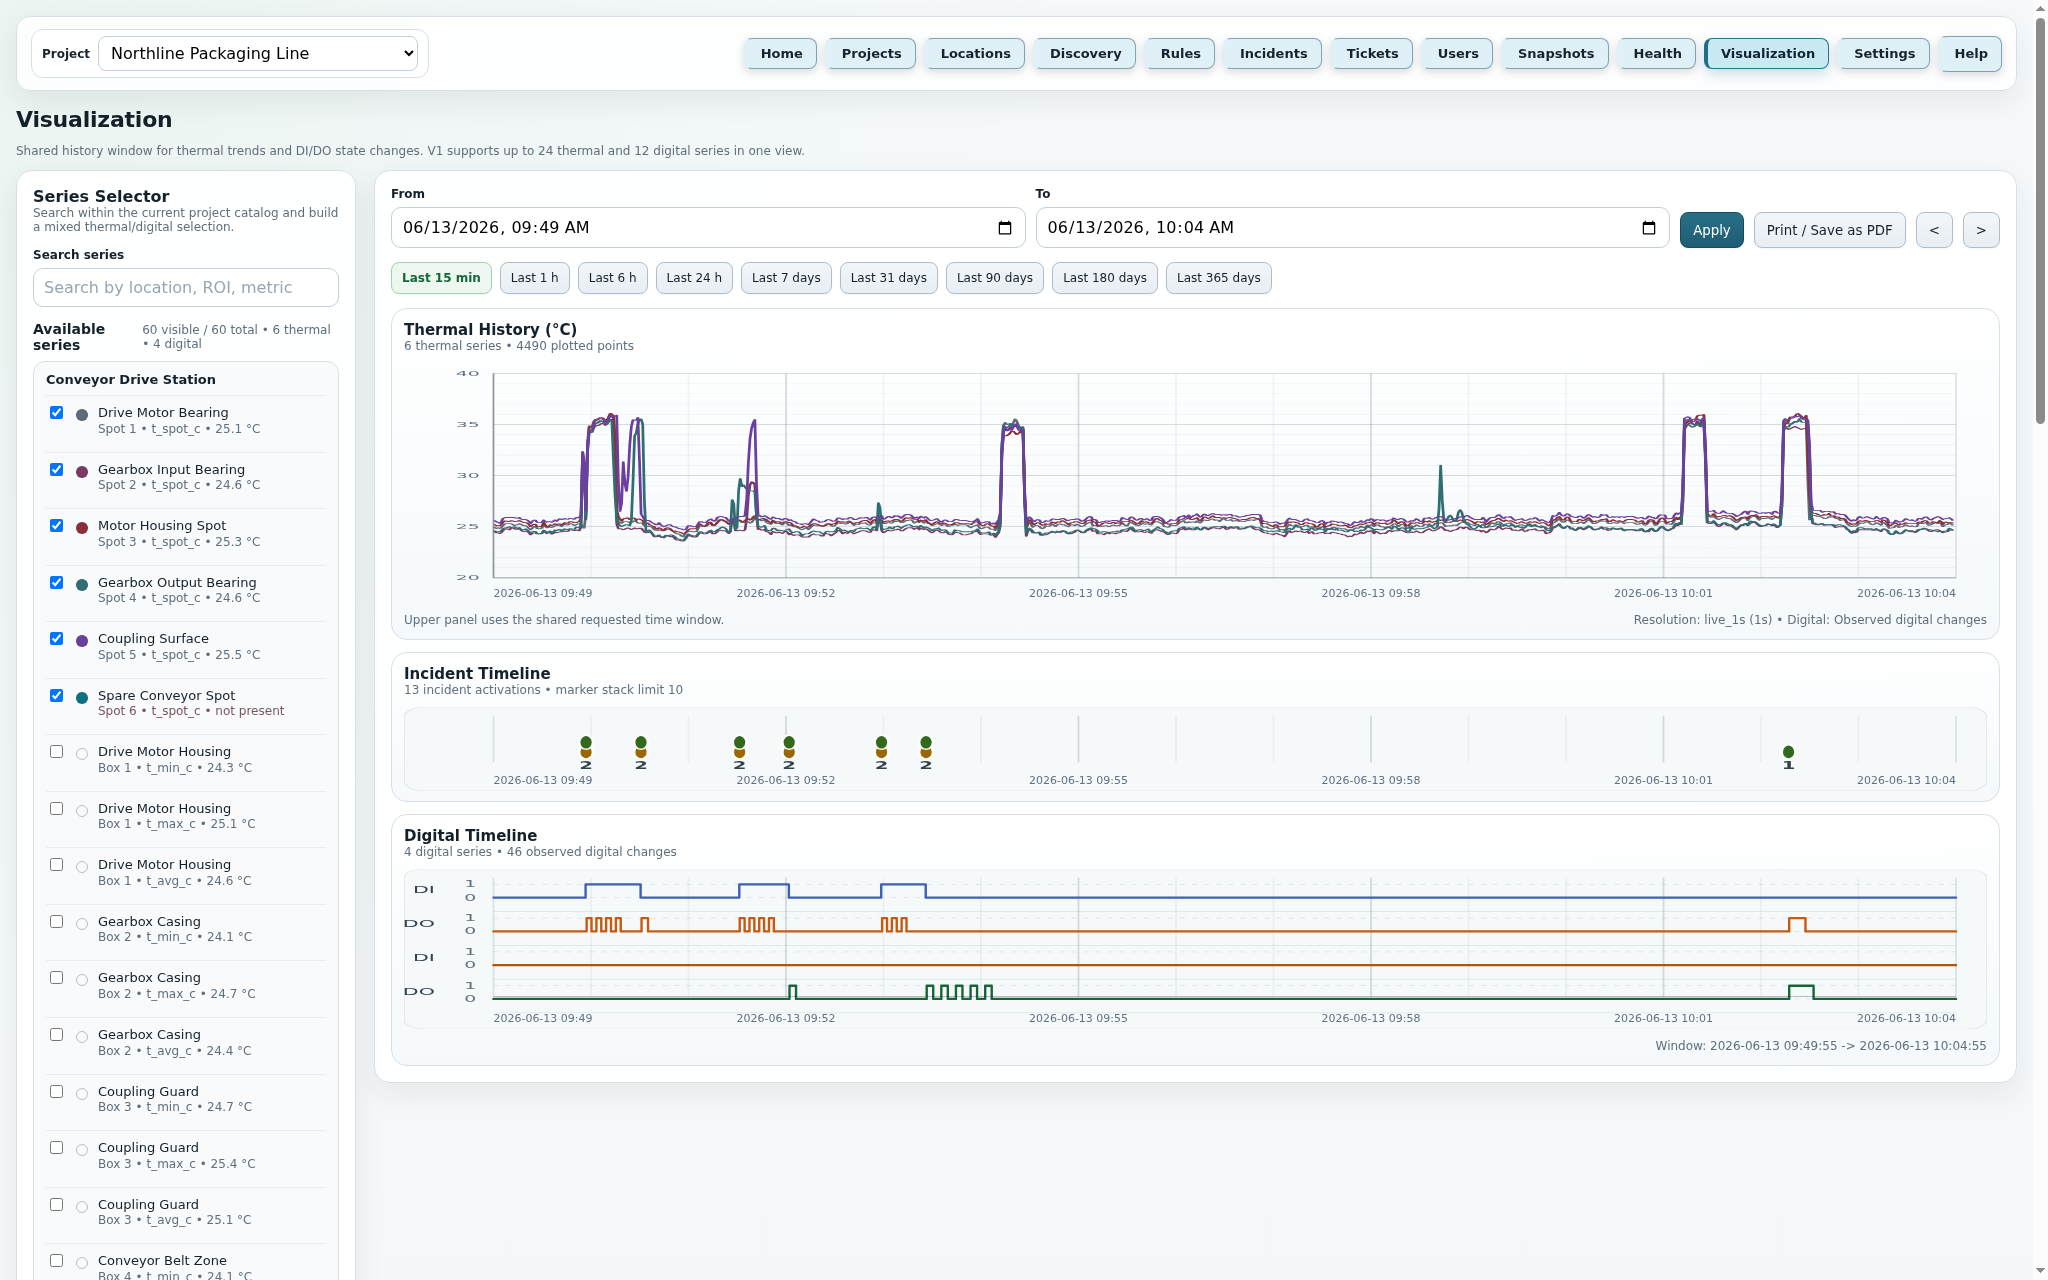
The Visualization view is the shared analysis view for measurements, incidents and digital states. The page helps users understand what happened before, during and after a rule activation.
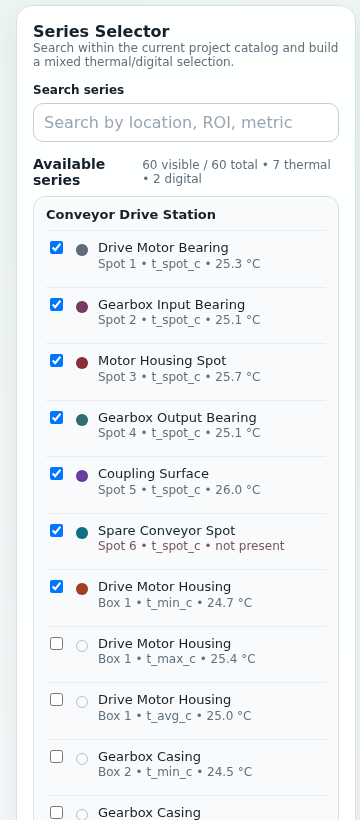
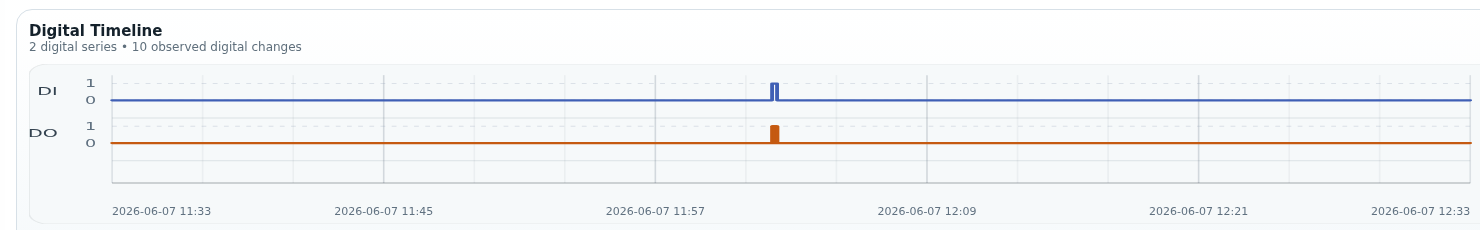
The left selection shows project-related series by location, ROI and metric. Search filters by these values; the Digital Timeline follows the catalog order by location name, then DI before DO. Current runtime values, stale notes, no value and not present help assess data quality.
From and To can be set directly. In addition, presets from Last 15 min to Last 365 days and arrows for shifting the currently selected window are available.
Apply reloads the current selection. Print / Save as PDF creates a printable snapshot with report header fields from Settings, selected series, charts, selected time range and project time zone.
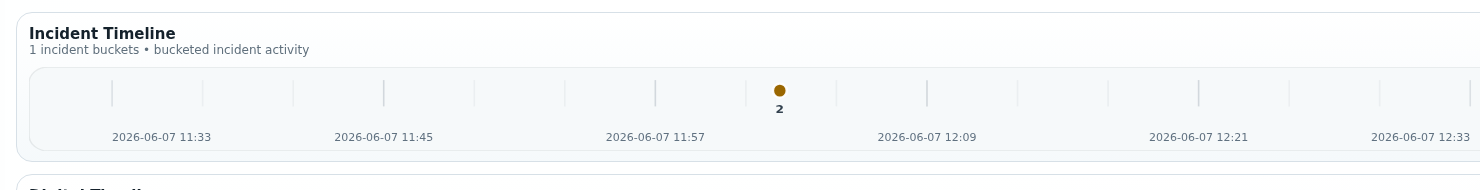
A double-click in Thermal History, Incident Timeline or Digital Timeline opens a 15-minute drill-down time window around the clicked timestamp.
When the cursor is over an incident circle, the browser shows a detail tooltip with rule name, activation time, severity, status, opened and closed timestamp. While a tooltip is active, auto-refresh does not interfere.
The global temperature display unit changes only UI labels and formatting; History API and stored values remain Celsius-based. After inactivity logout, admin, operator and technician users must return through Home/Login; viewer sessions use the configured viewer session lifetime.
When several incidents are too close together or a long time window is aggregated, markers show the count and a short breakdown by rules.
The small screenshots show the Series Selector and the three linked analysis areas: Thermal History, Incident Timeline and Digital Timeline.
JC Thermal Monitor
Settings collects runtime parameters that do not belong directly to a single rule or location, but influence system operation.
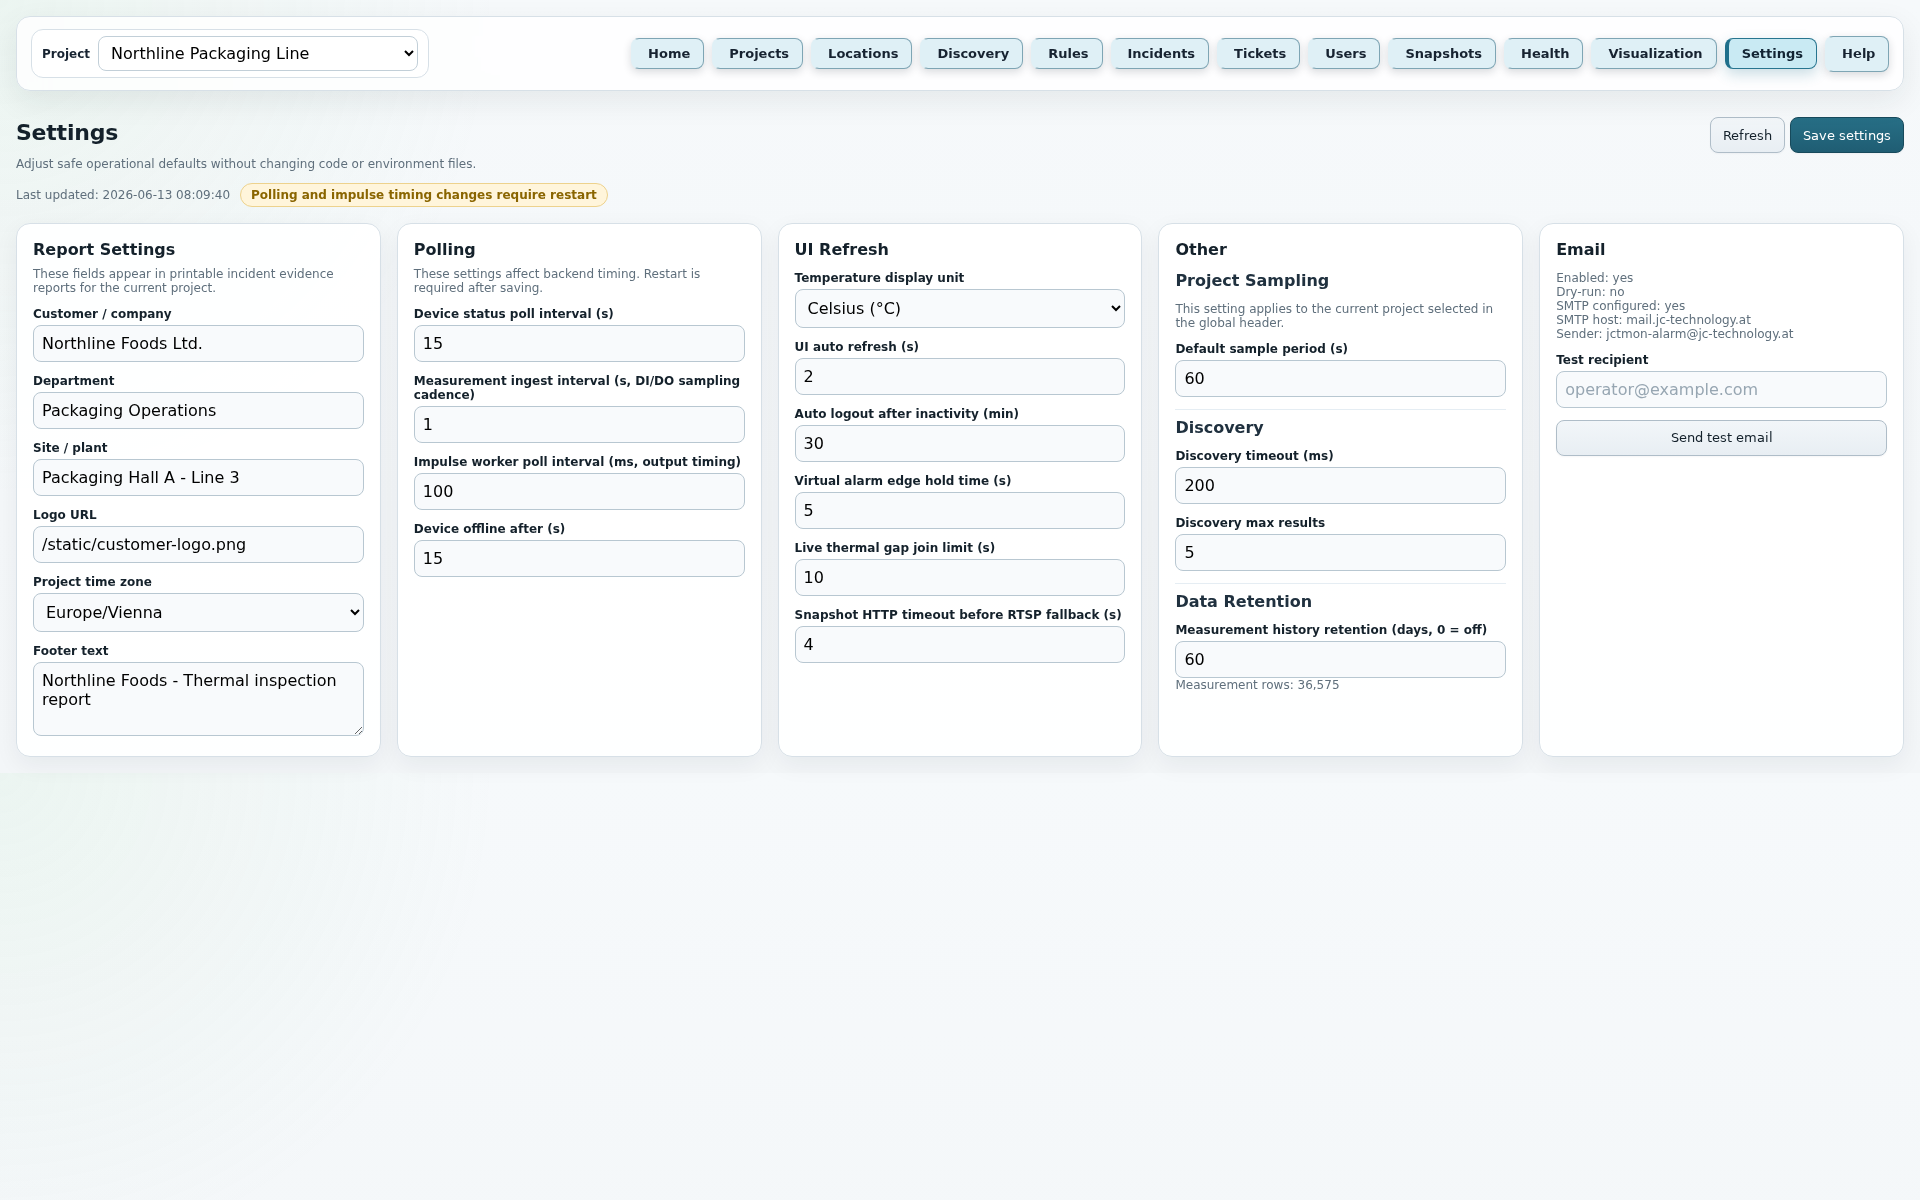
These points mirror the current application Help texts and describe the most important fields, buttons and runtime rules of this page.
Features
Supports spot and box ROIs plus camera-side digital inputs and outputs. Measurements can be stored per ROI with individual sampling.
Rules work per project with direct temperature, delta checks, digital states, edges, rate of change, hysteresis and cooldown.
On activation or clear, action jobs are queued: events, outputs, impulses, impulse stop, snapshot requests, torch control and e-mail run outside live ingest.
When an incident first triggers, relevant values are frozen. Later linked snapshots add dynamic image evidence.
Incident and trigger information can be displayed as a printable report view so cause, state and measures remain traceable.
Home and Visualization can serve as Viewer monitor views. Configuration, tickets, interventions and snapshot files are protected depending on role.
Technology
The application consists of a FastAPI web service, PostgreSQL/TimescaleDB, Alembic migrations and separate background processes. Poller, action worker, snapshot worker and impulse worker run separately so data acquisition, action jobs, image jobs and impulses can be monitored independently.