Detect changes
ThermalDIAG can continuously evaluate temperature rises, current curves, vibration metrics as well as digital and analog signals against project-specific rules. This makes trends, recurring deviations and gradual changes visible.

ThermalDIAG
ThermalDIAG is a local on-premise system for industrial plants where thermal condition, electrical load, mechanical vibration and machine signals need to be monitored, evaluated and documented together.
ThermalDIAG and ThermalDIAG Analytics are in the test and validation phase. ThermalDIAG has also been technically tested on the UniPi Edge E410 ARM64 reference platform; introductory prices and licensing models are defined; deployment and use are agreed for each project.
Benefits
ThermalDIAG can continuously evaluate temperature rises, current curves, vibration metrics as well as digital and analog signals against project-specific rules. This makes trends, recurring deviations and gradual changes visible.
An incident collects rule context, measurements, timestamps, actions and evidence so operators and technicians do not need to reconstruct events from separate sources.
Tickets, snapshots, work notes, measurements and reports support a structured workflow from the first alarm to the completed inspection.
Measurement service
After technical consultation, you can commission a time-limited measurement with a documented evaluation. The measurement setup, duration and prerequisites are set out in an individual quotation.
Development status and testing
ThermalDIAG can be ordered for local use after technical assessment. Configuration, scope and delivery dates are set out in the individual quotation.
System requirements
ThermalDIAG runs locally on a suitable Linux industrial PC (IPC). The exact sizing depends on the number of cameras, measurement points, signals, recording duration and required integration.
Already tested: Ubuntu 22.04 with 4 GB RAM in WSL environments, on Linux PCs and on an OnLogic CL260. These tests do not establish guaranteed production capacity.
Interface
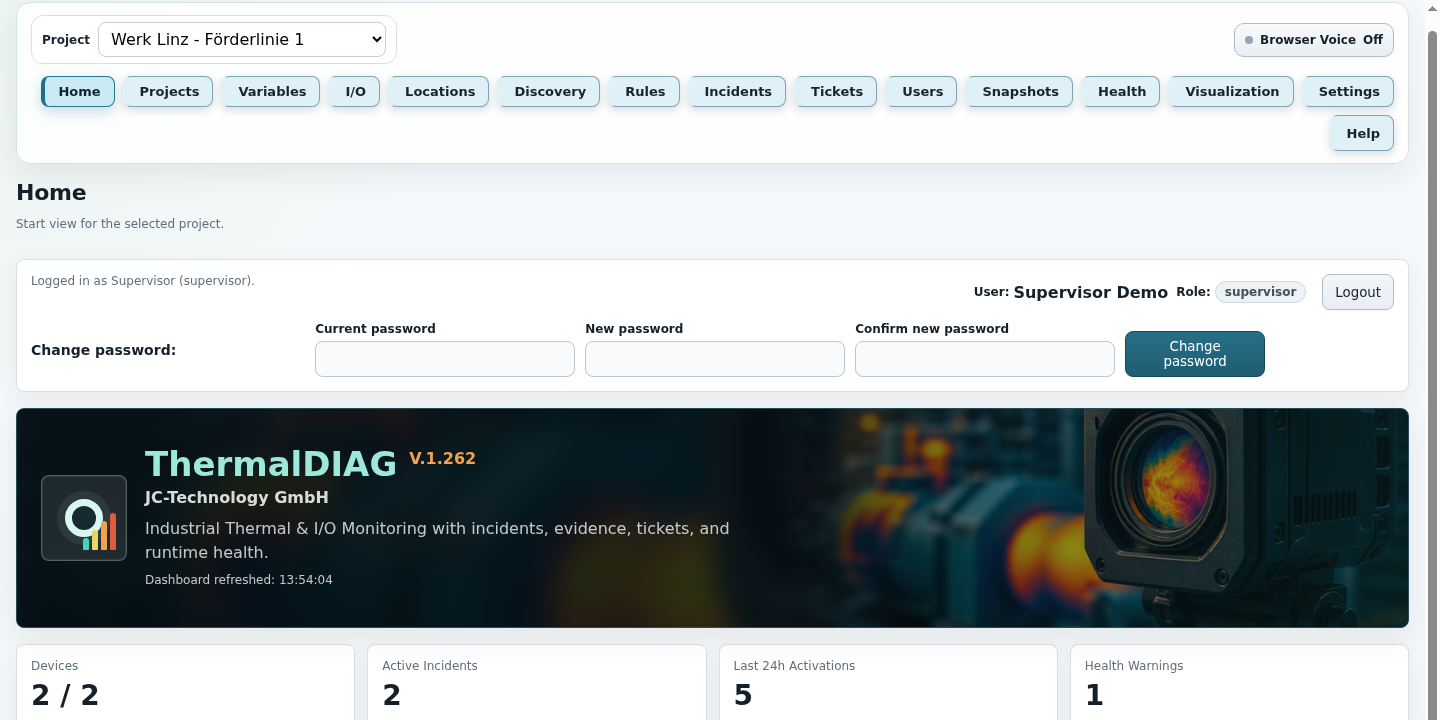
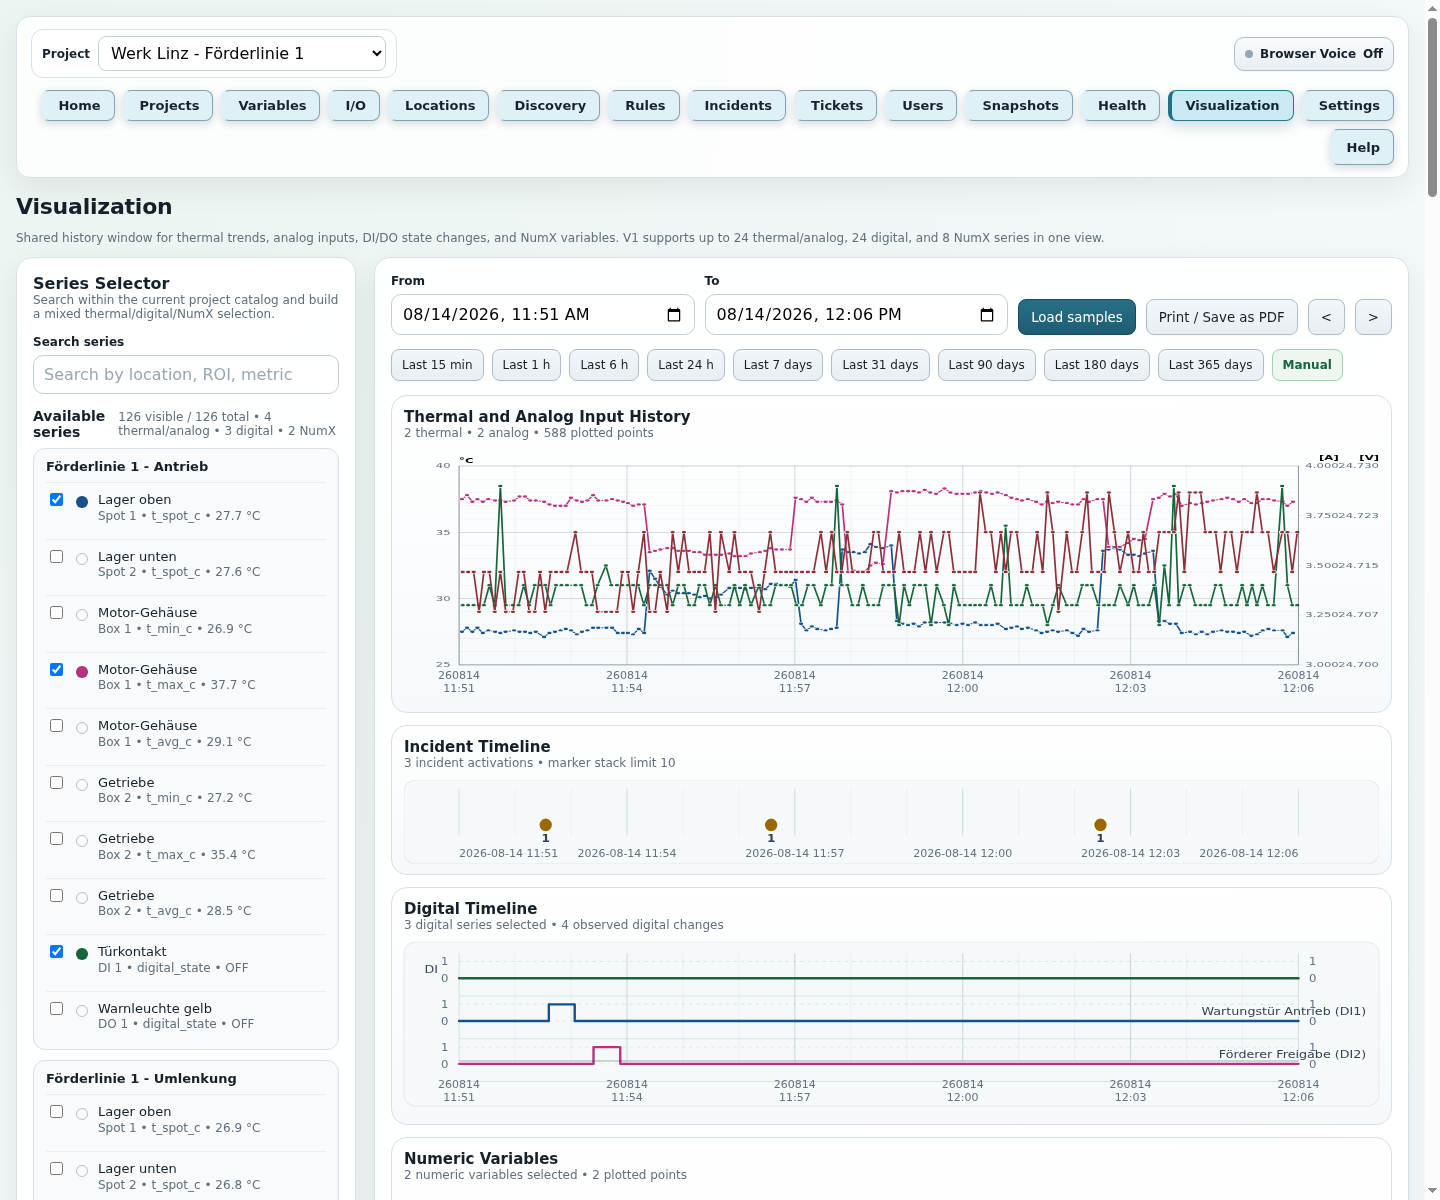
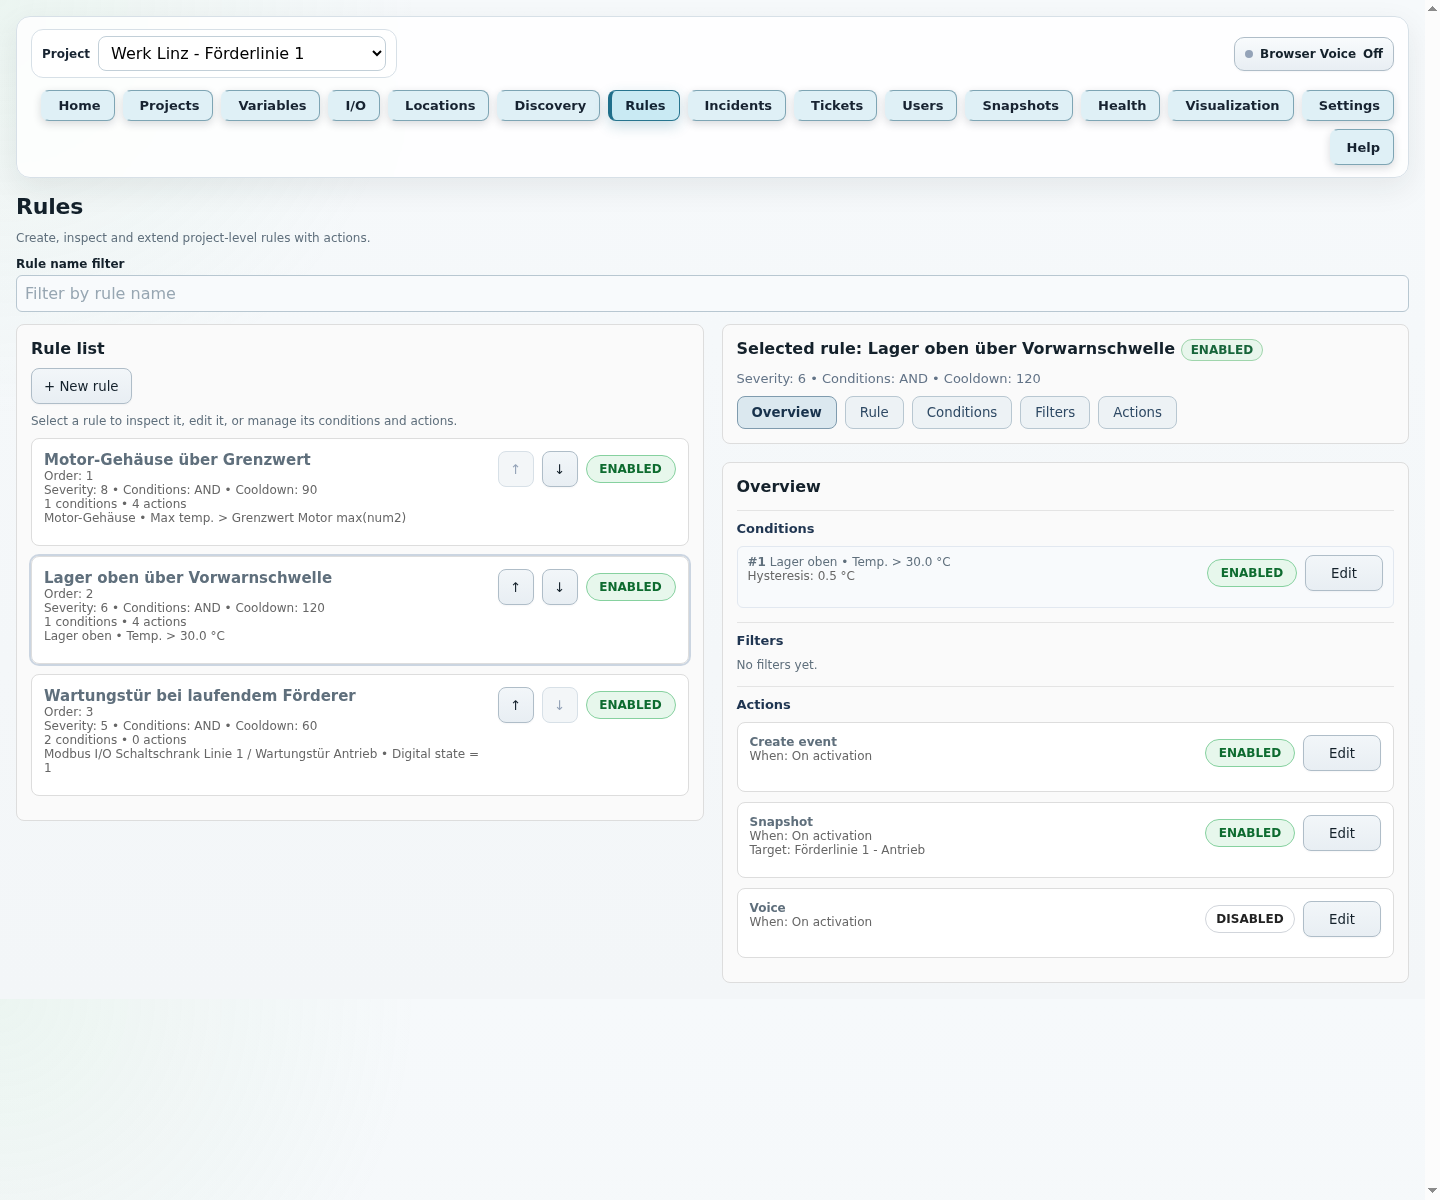
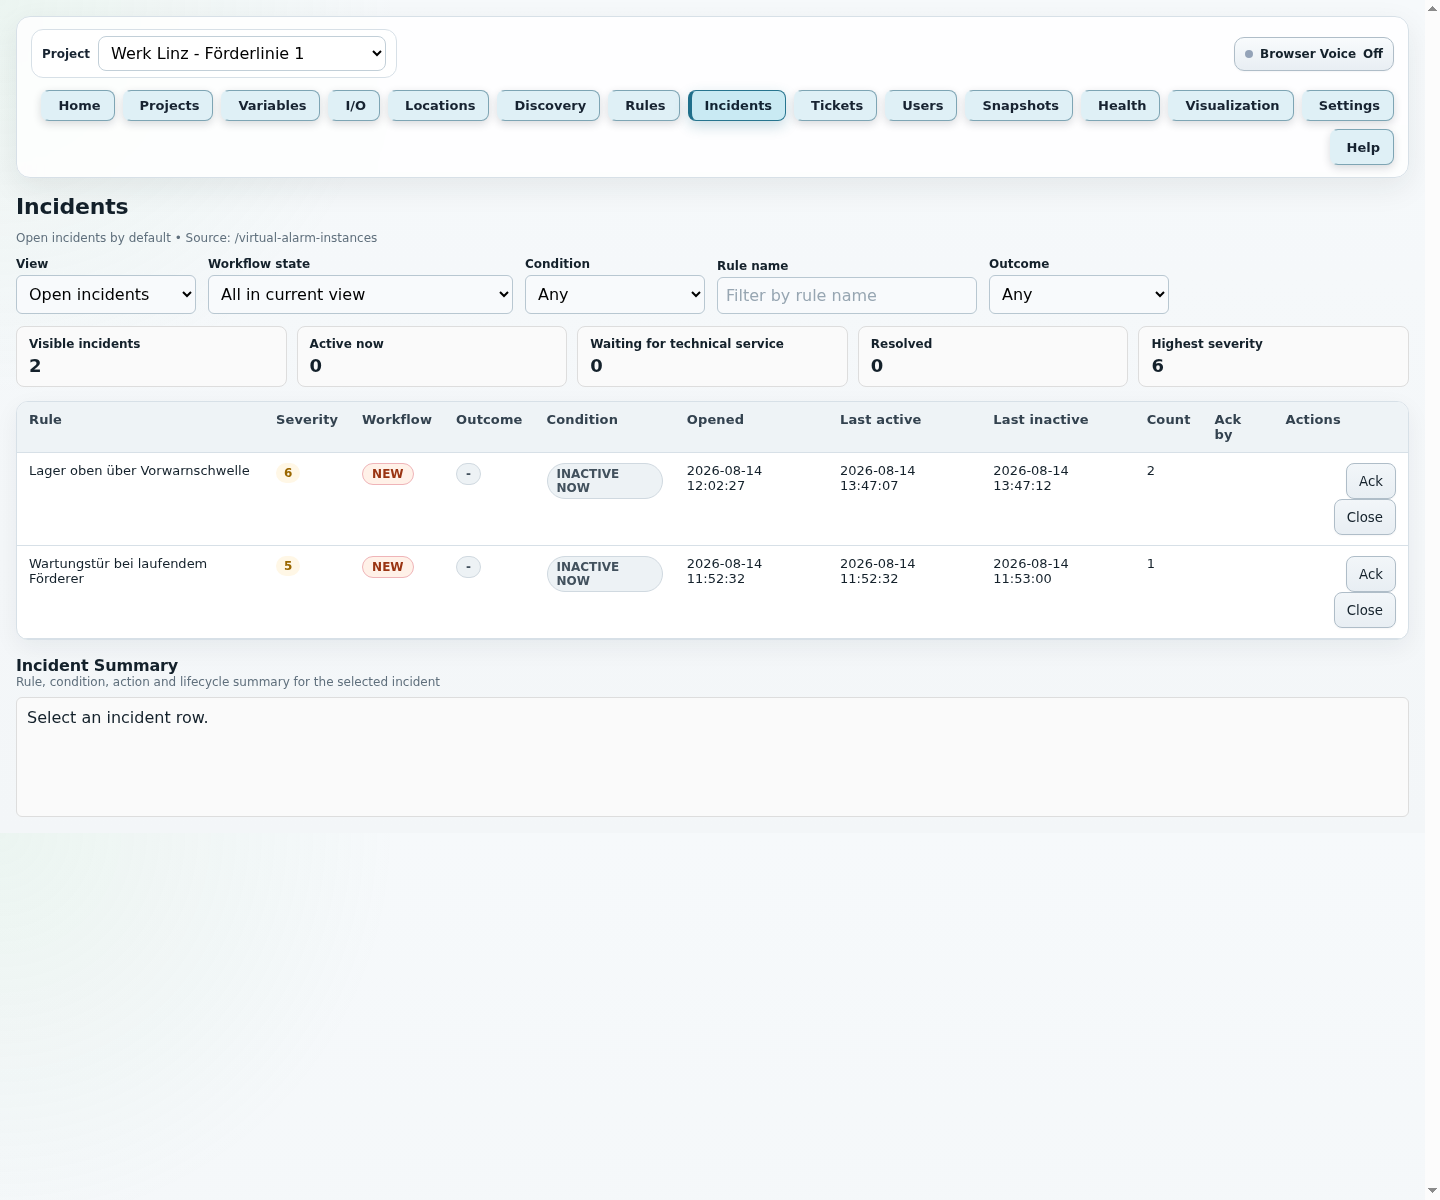
The images show interface examples, not customer references or validated example measurements.
Shared signal context
Visualization separates temperature history, analog inputs, vibration, digital states and numeric variables into clear bands. Signal aliases and technical names remain visible together.
Thermal-camera ROIs and other temperature measurements show local thermal changes.
Current, voltage and other analog channels are grouped by compatible unit for meaningful comparison.
Velocity, acceleration, frequency, kurtosis and crest factor support mechanical condition monitoring.
Camera I/O and multiple Modbus gateways provide time-aligned inputs, outputs and relay states.
Banner QM30VT2 and Seneca T201DCH100-OPEN are supported reference configurations. Naming, units and scaling are verified for each project.
The tooltip shows the nearest value for every visible curve, with a colour marker and an individual timestamp when sample times differ. Each series keeps its source visible.
In operation
Licence status and resumption
The licence page displays the current status in colour and warns when no more than 14 days remain.
Typical use areas
The examples describe possible applications, not proven customer deployments. Suitability depends on sensors, data recording and plant conditions.
Temperature, phase current, vibration metrics and machine state are viewed together so load-dependent or mechanical anomalies become easier to classify.
Thermal image data can be combined with current, switching or enable information for terminals, relays, load circuits and distributions.
ThermalDIAG supports combined views of temperature, signal state and measurements in plants with changing operating states.
When temperature rise, flow, enable or switching state must be interpreted together, ThermalDIAG keeps the relevant data in one history.
Not every project needs to become a permanent system immediately. ThermalDIAG can also be used as a time-limited measurement and diagnostics setup.
Incidents and tickets help turn an alarm into a traceable task with responsibility, measurements, notes, evidence and completion.
Project workflow
The following sequence describes project-specific setup after technical consultation and agreement on the order.
Rule function
ThermalDIAG rules connect measurements, states and approved reactions without classic program code. In addition to alarms, this supports project-specific test and auxiliary procedures that are not safety-related.
A prepared digital output can, for example, actuate a moving component. One or two limit switches provide position feedback while a numeric variable counts cycles and temperature, current or vibration is monitored. This keeps it traceable when and under which conditions a deviation occurs.
A deviation may be detected in the next rule evaluation cycle. Approved actions are then executed through their respective action processing. Calculated numeric variables can be used in subsequent rule evaluations. There is no deterministically guaranteed response time for detection or execution.
Technical scope:
Boundary: ThermalDIAG runs on a Linux IPC and is not a real-time system. Rule evaluation typically operates in the seconds rather than milliseconds range. ThermalDIAG does not replace a PLC or safety controller. Safety functions, emergency stop, protective interlocks and time-critical end-position monitoring must operate independently.
Physical outputs may only be enabled by qualified personnel after a project-specific review of the electrical, mechanical and safety-related conditions.