ThermalDIAG Analytics

Understand past behaviour. Validate alarm rules safely.

ThermalDIAG Analytics is a Windows application for recorded ThermalDIAG data. It presents temperature, current, vibration, analog measurements, digital states, incidents and rule reactions in one shared time context.

ThermalDIAG and ThermalDIAG Analytics are in the test and validation phase. ThermalDIAG has also been technically tested on the UniPi Edge E410 ARM64 reference platform; introductory prices and licensing models are defined; deployment and use are agreed for each project.

ThermalDIAG Analytics can be ordered after technical consultation on the basis of an individual quotation. Suitability, scope and delivery dates are agreed before an order is placed.

Benefits

Review rules and events without disturbing live operation.

Search for the cause in the timeline

Temperature, current, vibration, analog values, digital states, incidents and available action markers are viewed together. This makes it easier to see which state deviated first before an event.

Check a rule idea before release

A rule can be copied locally, adjusted and simulated on historical data. For reproducible tests, numeric control points and DI/DO state changes can be added as a local test-data overlay, restored and exchanged as JSON. The original data and the rule in the running ThermalDIAG system remain unchanged.

Revisit rare faults

When a fault occurs only rarely, the recorded historical period can be analysed again without forcing the fault to occur again at the plant.

Assess trends and stability

Historical curves and trend models can show gradual changes and a calculated continuation of selected values. This supports technical assessment but is not a guaranteed forecast.

Development status and testing

Windows analysis for recorded ThermalDIAG data.

ThermalDIAG Analytics runs on a Windows workstation or a separate analysis computer.

  • Windows application in the test and validation phase.
  • Analysis of data recorded by ThermalDIAG.
  • Historical evaluation and rule validation separate from live plant operation.
  • Not a general-purpose analysis system for arbitrary data sources.

Time-synchronised views

Each signal type stays readable without losing its context.

  • Examine DI counter values and increments in Measurements, Trend and Backtest and use them as numeric rule conditions. Counter reset actions are evaluated as previews only; Analytics does not reset physical counters.
  • Separate bands for temperature history, analog inputs, vibration, digital timeline, NumX and events.
  • Alias first and technical signal name alongside it, so operations and commissioning can identify the same curve unambiguously.
  • Shared time axis and synchronised cursor position across Timeline, Samples and Trend.
  • The Last 15 min view can show released live-buffer data for an active current project, including enabled series that are not written to persistent history.
  • Relative selection up to 180 days; a manually selected range can cover up to 365 days.
  • Export recorded Timeline data for further evaluation without changing the original data.
  • Voice markers can be played manually on Windows 11; Auto Voice plays only newly arriving messages in the Last 15 min view, once.
  • Local backtests and rule variants remain separate from live operation.

Interface

Historical data, rule ideas and simulations in one shared context.

The images show interface examples, not customer references or validated example measurements.
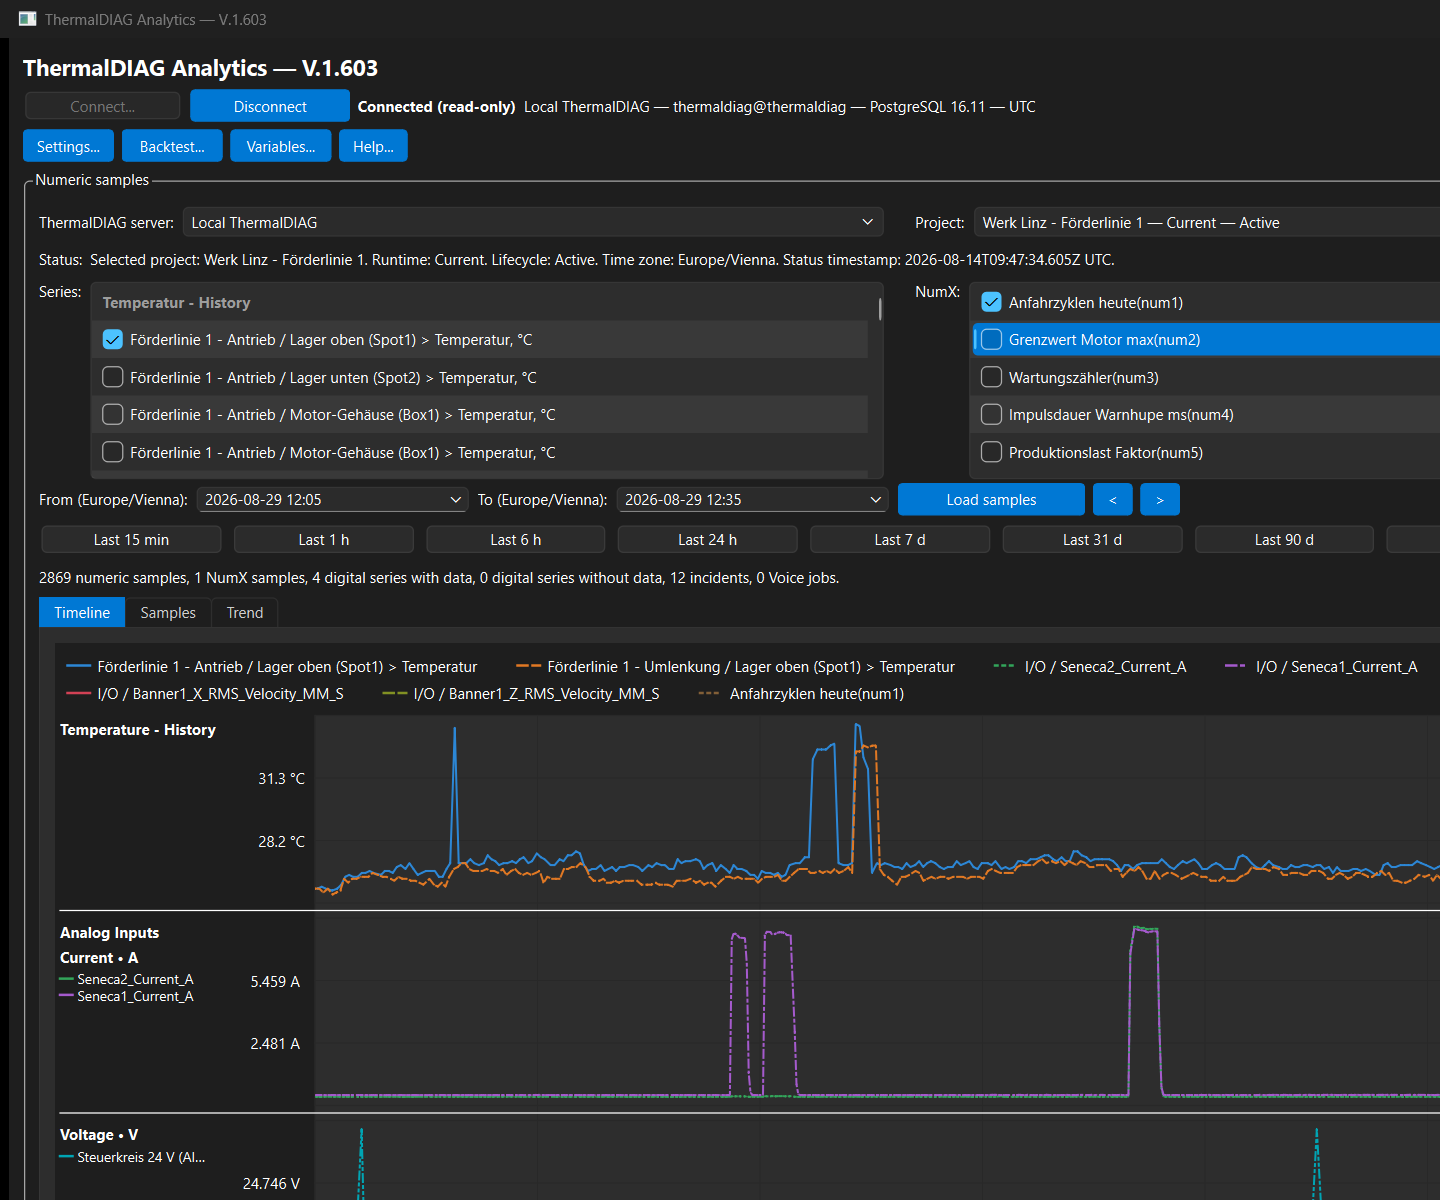
ThermalDIAG Analytics timeline with temperature curves, digital signals and event markers
Timeline
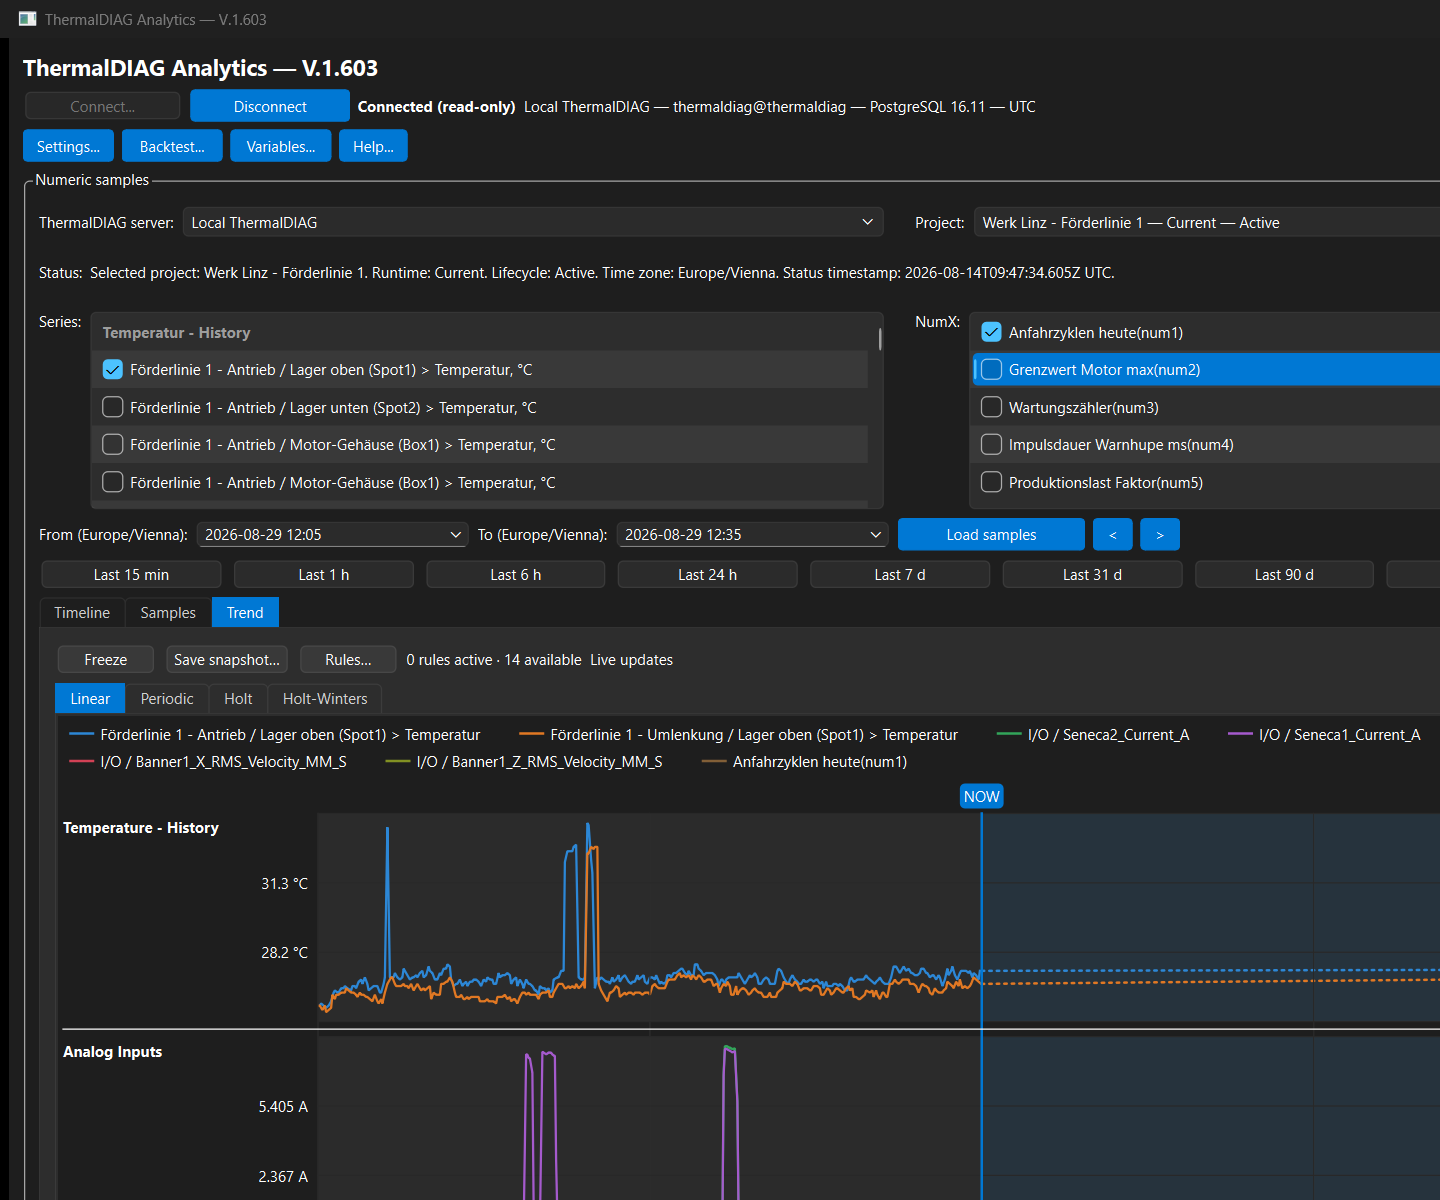
ThermalDIAG Analytics trend view with historical curve and calculated continuation
Trend view
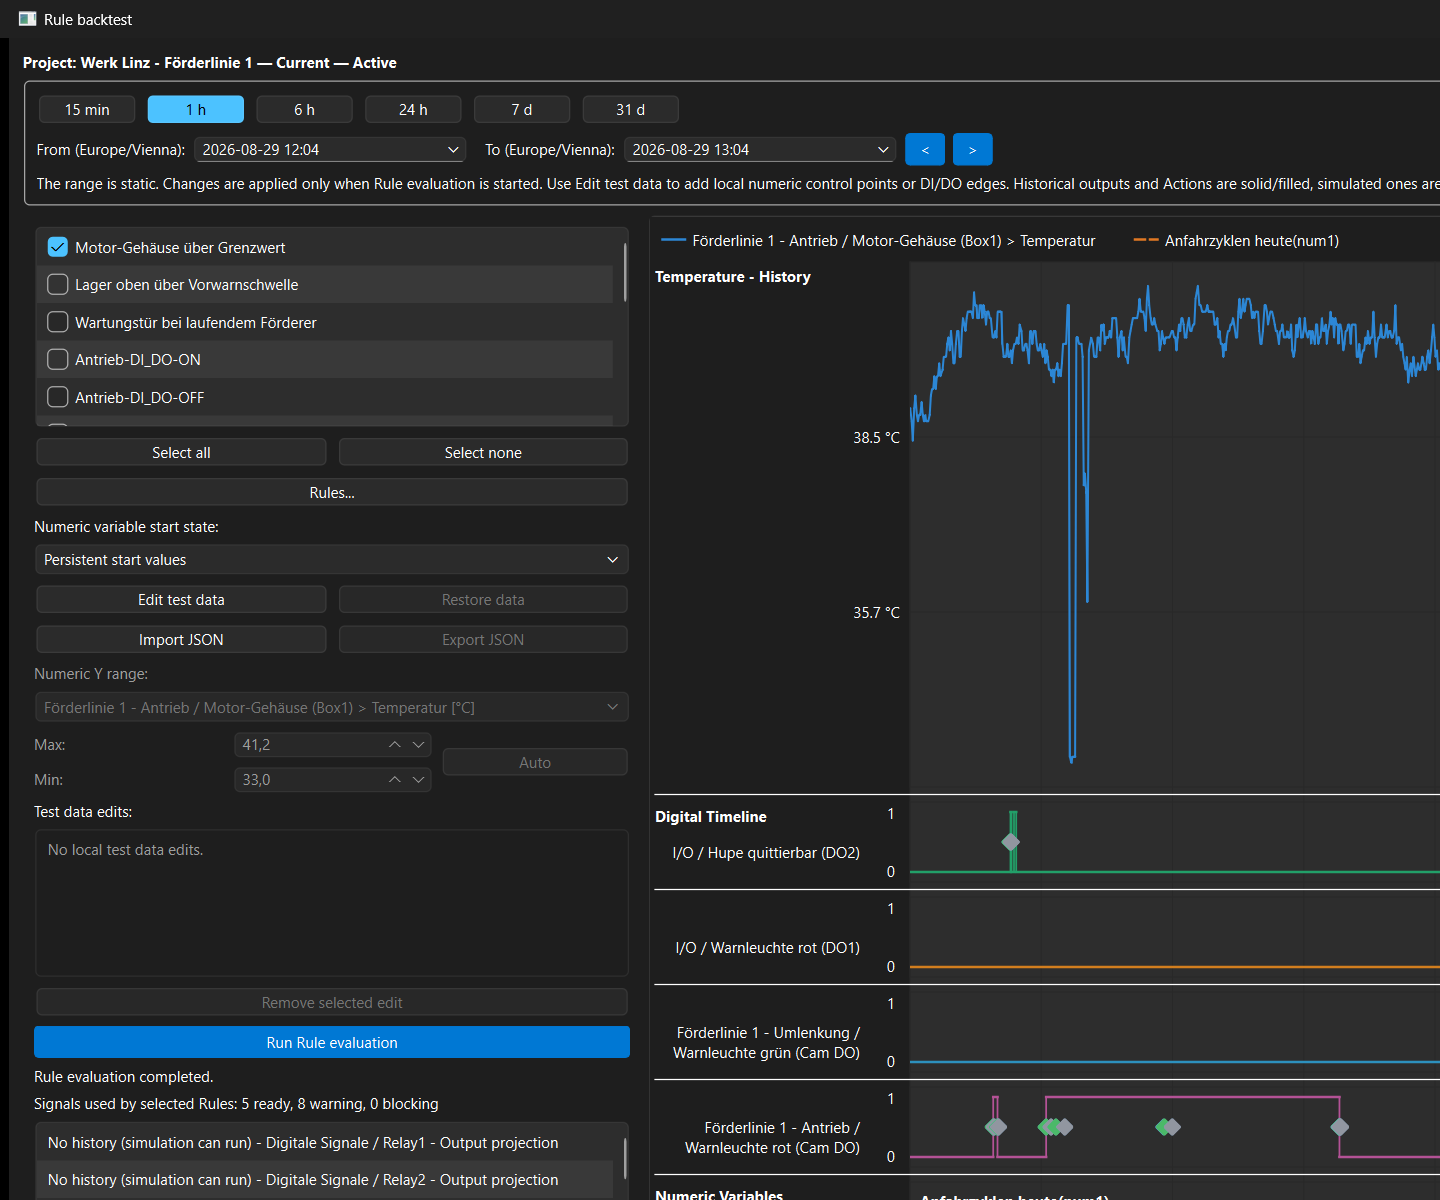
ThermalDIAG Analytics rule backtest with simulated incidents, outputs and numeric variables
Rule backtest
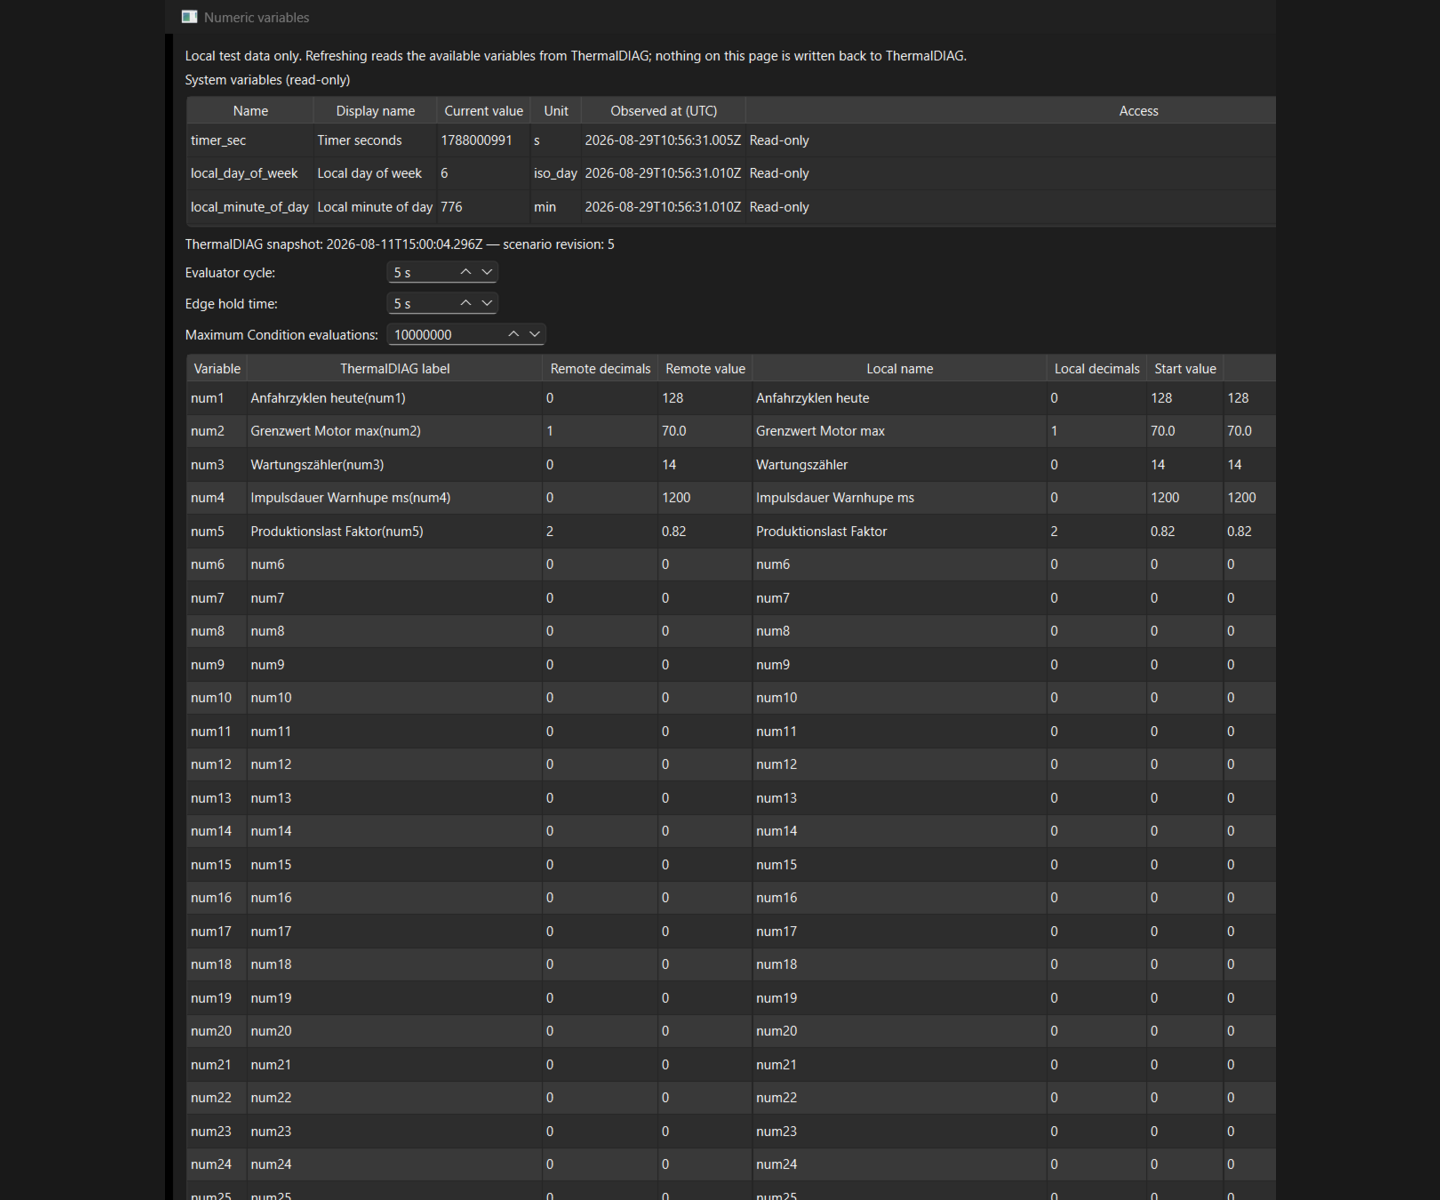
ThermalDIAG Analytics variables view with read-only ThermalDIAG values and local start values
Numeric variables
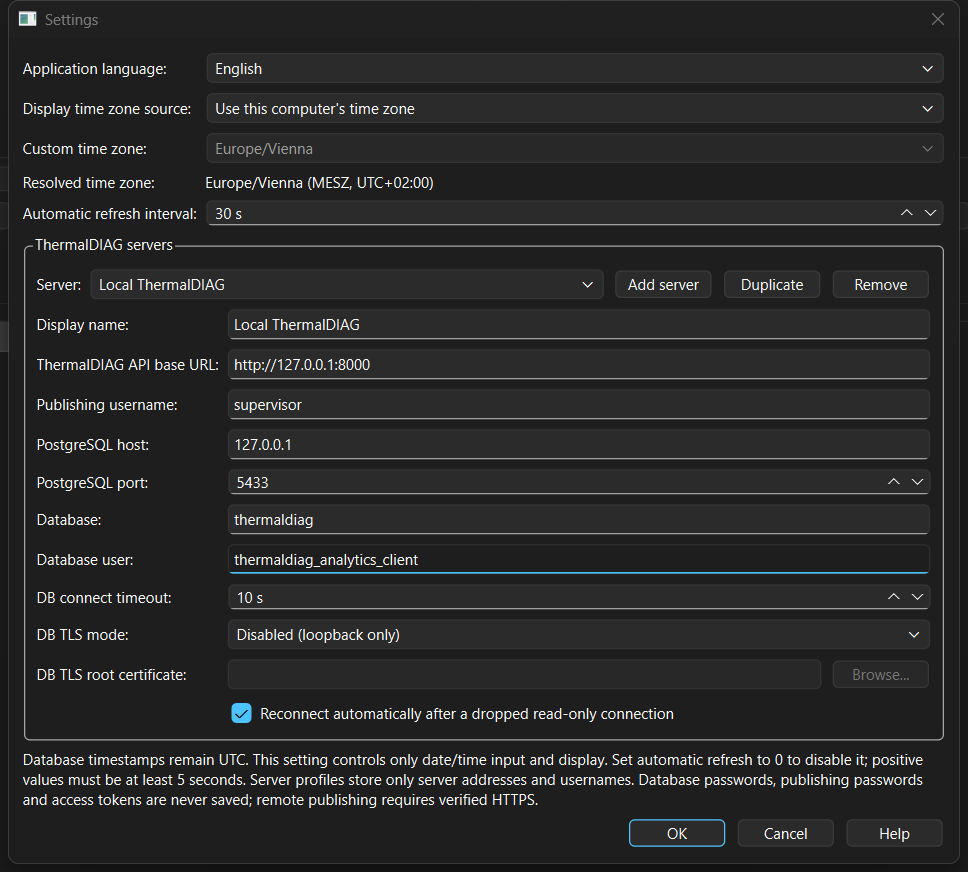
ThermalDIAG Analytics settings for language, time zone, refresh interval and server profiles
Settings

Typical questions

Questions Analytics can answer after an event.

Why was this incident triggered?Analytics shows the period before, during and after the incident so temperature, current, vibration, analog value, DI/DO state and event markers can be checked together.
Would another rule have worked better?Threshold, hold time, hysteresis or filters can be adjusted locally and compared with the actual historical trend in a backtest.
Was an alarm too sensitive?A rule variant can be applied to normal and abnormal time ranges. This makes it easier to see whether it would have reacted too often, too late or not at all.
Is a condition slowly moving in a critical direction?Trend views help detect slow thermal, electrical or mechanical changes and make them traceable for technical discussion.

Safe analysis workstation

Analysis remains separate from live plant control.

ThermalDIAG Analytics reads recorded data using restricted access. Trend, local rule preview and backtest operate separately from live operation and do not execute real switching commands or other external actions.

A separate rule list can model the simplified behaviour of a machine, mechanism or process. It evaluates simulated inputs and produces simulated output states or numeric variables according to its internal logic. This allows normal and faulty states to be tested repeatedly without moving a physical machine. It is a simplified simulation, not a physically accurate digital twin or live control system.

When a checked rule idea is handed over to ThermalDIAG, a new disabled rule is created there. Deliberate professional release happens later in the ThermalDIAG system.